

Whenever you run a campaign, typically your revenue data will be immediately accurate since its coming from real-time postback URLs or other tracking.
However, cost can be a little more awkward. If your traffic source is able to pass an accurate cost with each click, great! But most sources cannot, especially those where you pay on a CPM basis (per impression), as its mathematically nonsensical to calculate a cost-per-click each time a user clicks and advert, then pass it to the tracker.
The solution? You need to retroactively update costs.
You can do this in our Update Costs section.
There are three ways to do this:
- A simple update
- Segmentation by pasting a table of data
- Upload of a suitable CSV containing cost data
Simple updates
A simple update involves setting a cost for a generalised segment of traffic.
You can apply a total cost to matching data, in which case that cost is divided across all visitors, or set the cost per visitor directly.
Firstly, go through these steps to define the conditions for your update:
- Choose the funnel
- Choose the traffic source. You can only do one source at a time, because cost data must come from a specific traffic source right!
- Select the time period that your cost data is coming from. We suggest doing regular updates for Yesterday so that you do daily updates, to keep your daily ROI data accurate.
- Make sure the timezone you pick matches the timezone used in the traffic source reporting, as you are trying to match the data here
- Select a campaign (optional) if necessary -- usually you won't need this unless you are updating one campaign at a time
- Lastly, select the update style. Usually you will want the option "I want to set total cost of the matching traffic". This is because you'll be uploading a total cost, and our system will then spread that cost out over all matching visitors.
As below:
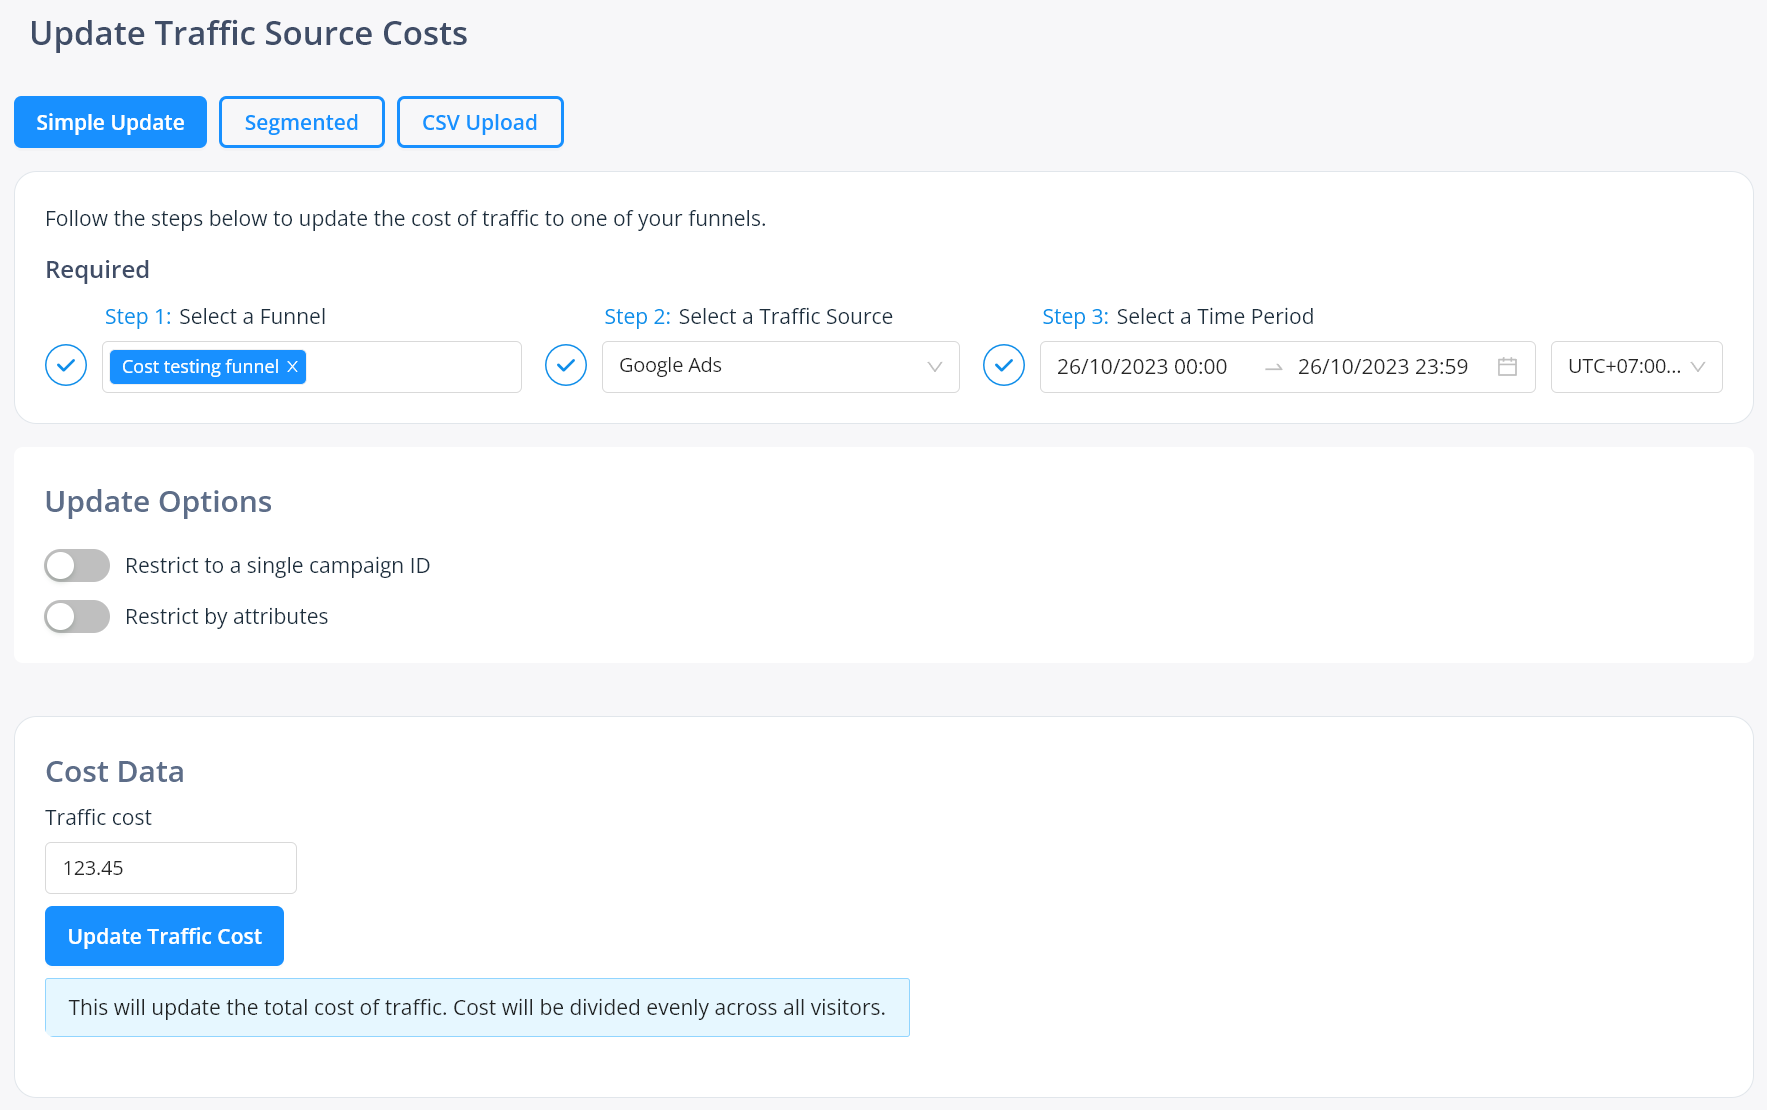
Once you have these settings correct, enter the total cost of your traffic, as from your traffic source reporting, and hit update.
Want to reset the cost of your traffic to zero? Enter 0.00 as your cost value and submit.
Example:
- You select Funnel A, Facebook, Yesterday and put $78.34
- You click update cost
- Our system queries your data and finds that for Funnel A, yesterday, for traffic source Facebook, there was 491 visitors
- From this we calculate an average cost of $78.34/491 = $0.1596
- We apply this cost value to all matching 491 visitors
Now, this is just an approximation. It's impossible to know the exact true cost of each visitor, since at a traffic source it may vary per device type, OS, gender, age, placement, site ID, etc.
The best we can do is approximate BUT we can segment our data further to be a little more accurate, as below.
Segmented cost update
For this, do the same as you do above for basic mode.
However, rather than putting a single total cost, we can segment the cost further based on data from the traffic source.
For Google Ads for example, we would ideally segment all costs at the ad level.
For other sources we might want to segment at the creative level, or the site ID level, or perhaps the combo of both!
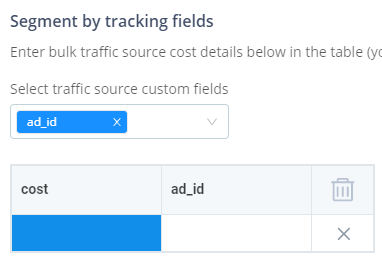
For this, select advanced mode. You'll be asked to select one or my custom fields, which are data fields from your selected traffic source:
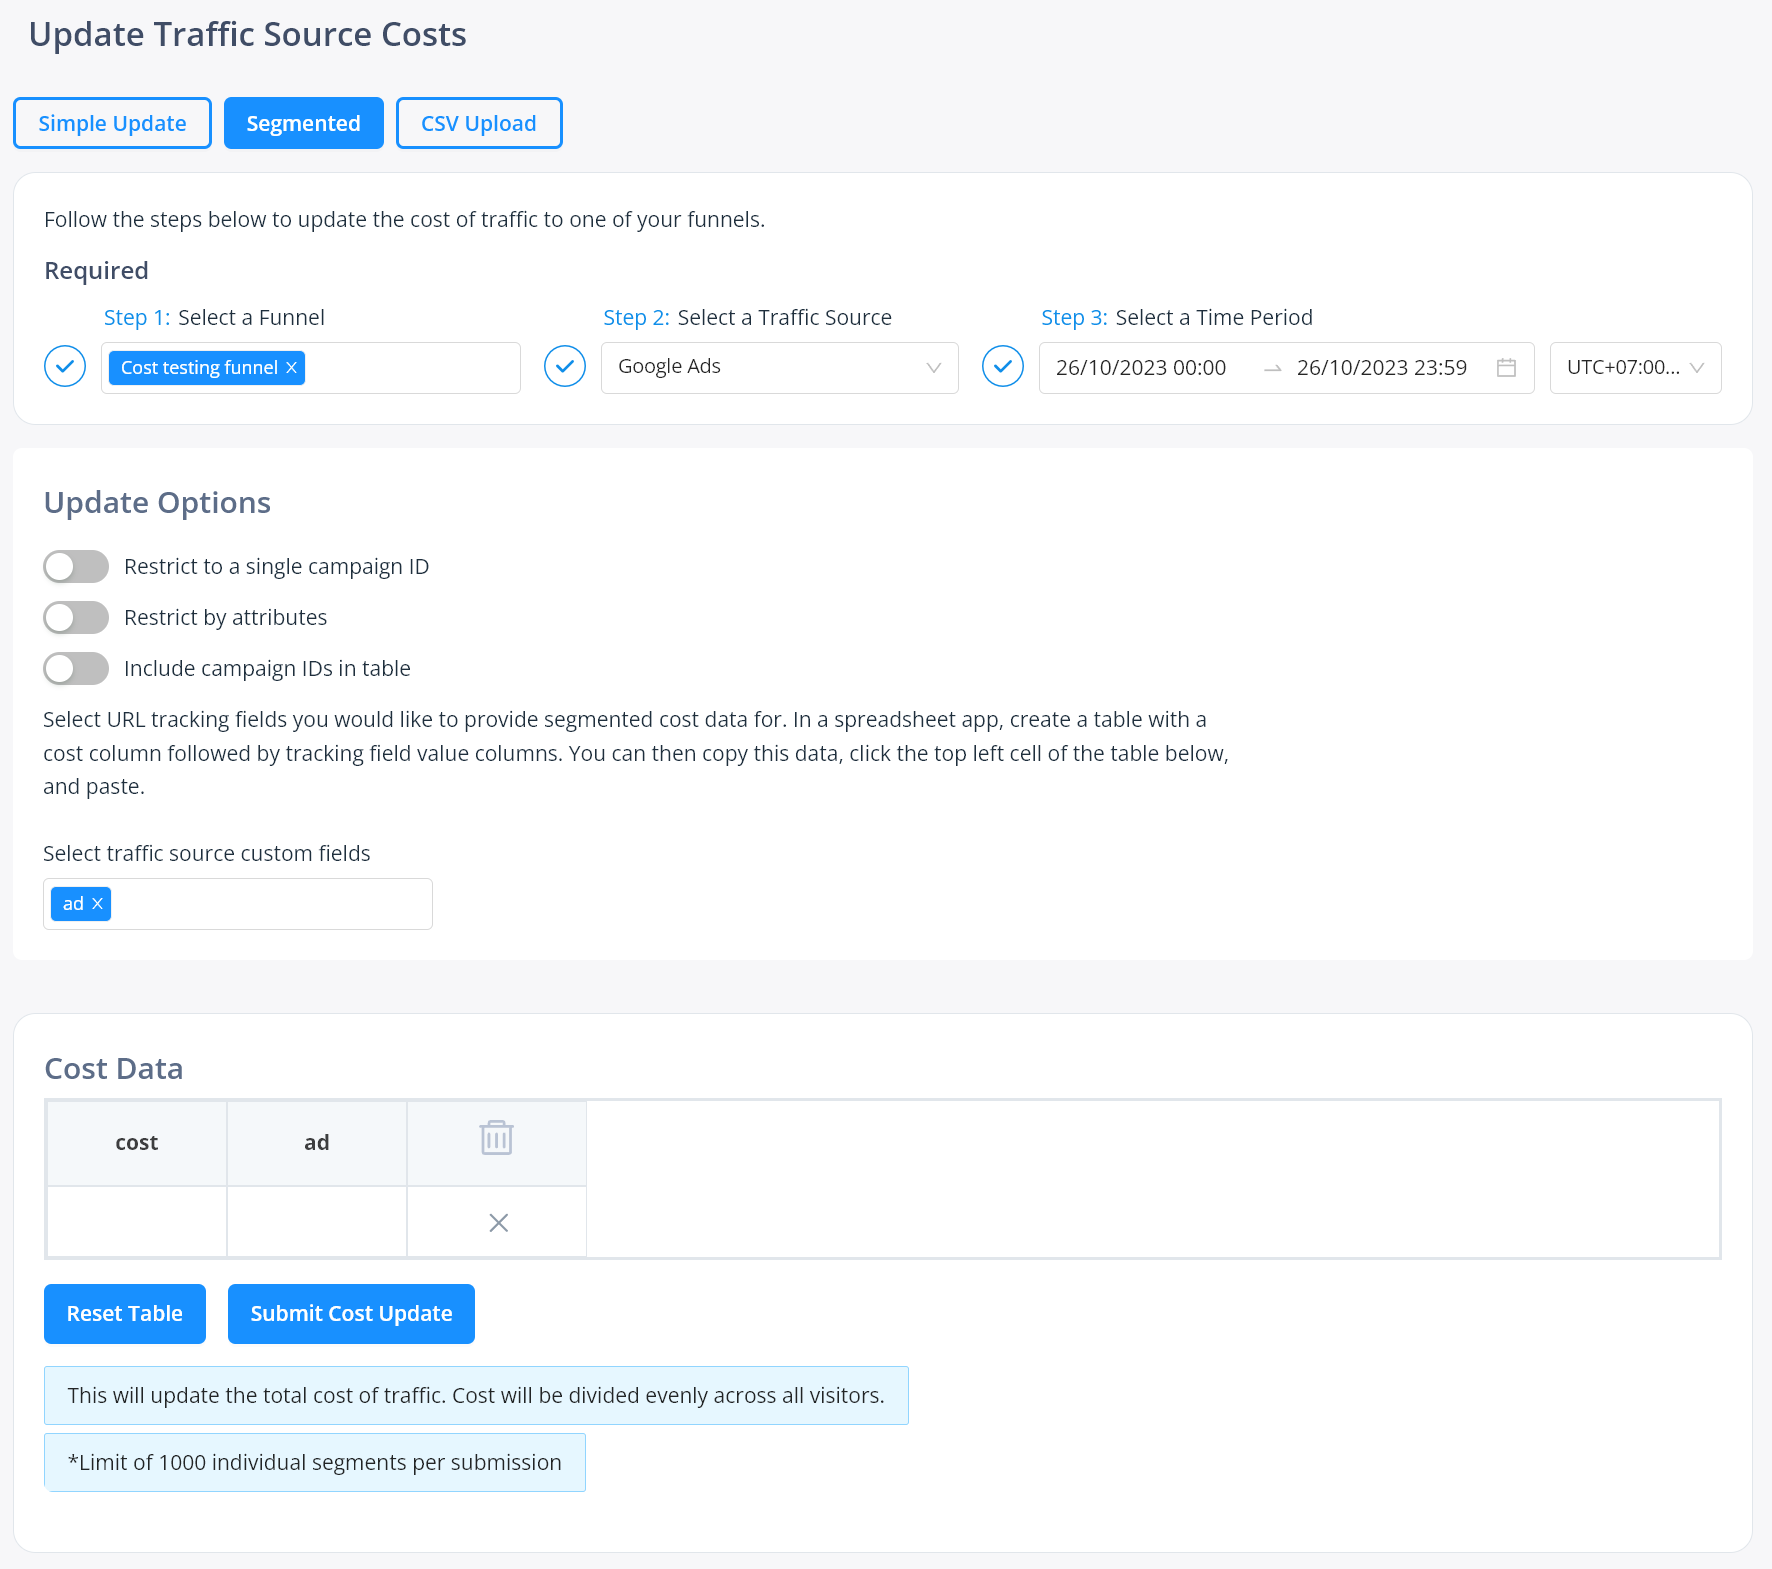
This data passed from the traffic source has labelled all your users, so we can use it to apply segmented cost updates.
Now, carefully export data from your traffic source (e.g. a CSV) that segments by this parameter and provides cost data for the date range you selected.
For example with Google Ads, we would go to the ads area, show reporting for yesterday, edit the columns to show ad ID, then export to CSV.
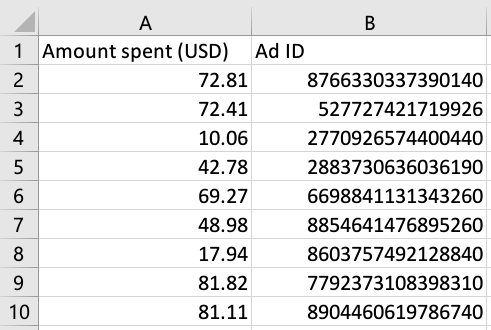
That exported file would now contain many different columns including the ad ID and the spend column. We can then strip away the other columns and arrange them so we have cost on the left, ad ID on the right:
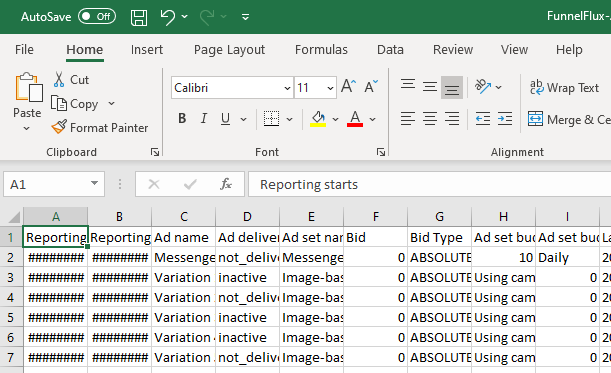
Delete columns and shift them around giving:
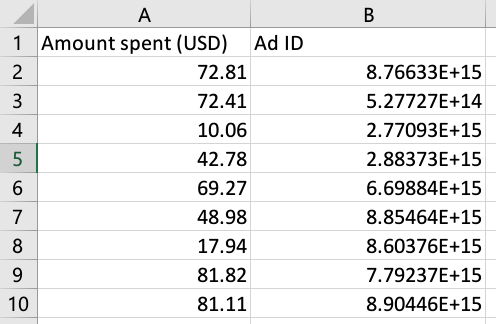
Note something important here -- Excel is doing its usual nonsense with truncating a large number and showing exponent form (E+XX). We don't want this at all. Right click the entire column > set it to Number with 0 decimal places:
If we don't do this, and we copy these cells to the clipboard, it will literally copy the E+12 style data, which will not match data in FunnelFlux at all. Apparently Excel, after 20 years, is finally receiving an update that lets you turn this annoying automatic data typing feature off... yay! (but probably won't be the case in your app when reading this).
Now that you have this set up, copy the columns. You can just select the columns to copy everything. Now in FunnelFlux, click the top left cell of the table. It will go blue, indicating its selected:
Now just hit Ctrl+V to paste!
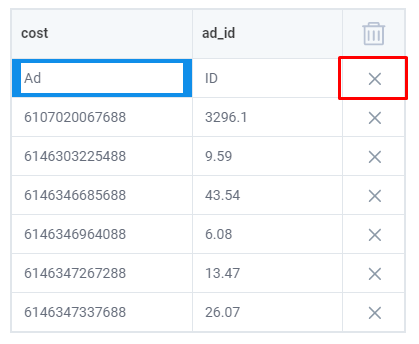
You can then remove the top row, since we don't want/need this.
This now gives FunnelFlux a set of segmented data to work with. It will go through your funnel/traffic source/date range window, then further segment by ad ID and average the cost separately over each ad.
This way, the CPC on each visitor from each ad will be correct, rather than being the average of the entire spend from the traffic source.
For sources like push, pops, native, you can use the same approach but segment by something like site ID, publisher ID, etc.
CSV-based updates
For even easier bulk updating, we now support uploading CSVs.
Note it will be your responsibility to make sure the CSV meets our data formatting requirements, as below:
- Cost data should all be valid numbers. Any blank cost values will be removed when processing the uploaded file
- The column header for cost must be
costnot something else e.g. ad spend - For any selected tracking field, a column header with an identical name should exist
- All rows should have values in every cell, for the ones selected -- rows having any empty values will be removed
- If choosing to segment by date in the CSV, please use a common date format, not including times (see later in this document for supported formats)
On uploading, our system will provide error messages for common issues.
You can review the CSV data in the table below the upload button, then choose to submit when ready.
Note uploads are currently limited to 5000 rows.