

Please note the following limitations:
- AI nodes are a paid addon. You will need to purchase the addon subscription in the billing area
- Only some lookback windows and frequencies are available depending on your subscription
- New levels of AI node functionality and complexity will be released over time
What are AI nodes?
AI nodes function like a normal rotator node but are able to intelligently route traffic to different destinations, once enough data is available.
They work by running automated reports on your data and creating routing profiles based on conversion rate or revenue per view data, using Bayesian Inference statistical methods.
They are extremely customisable and make it possible to dynamically route your traffic to the best nodes or pages on autopilot.
How do I use them?
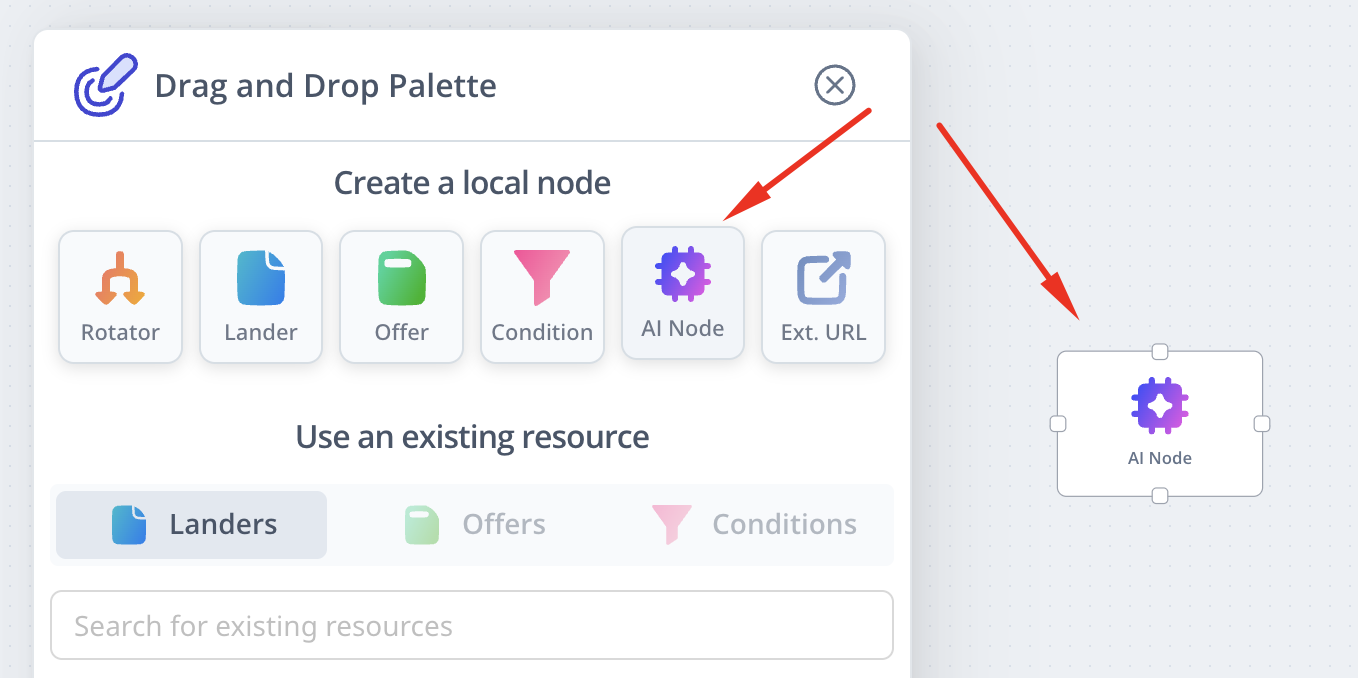
Within the funnel builder you can create an AI node with the right-click menu or from the node palette:
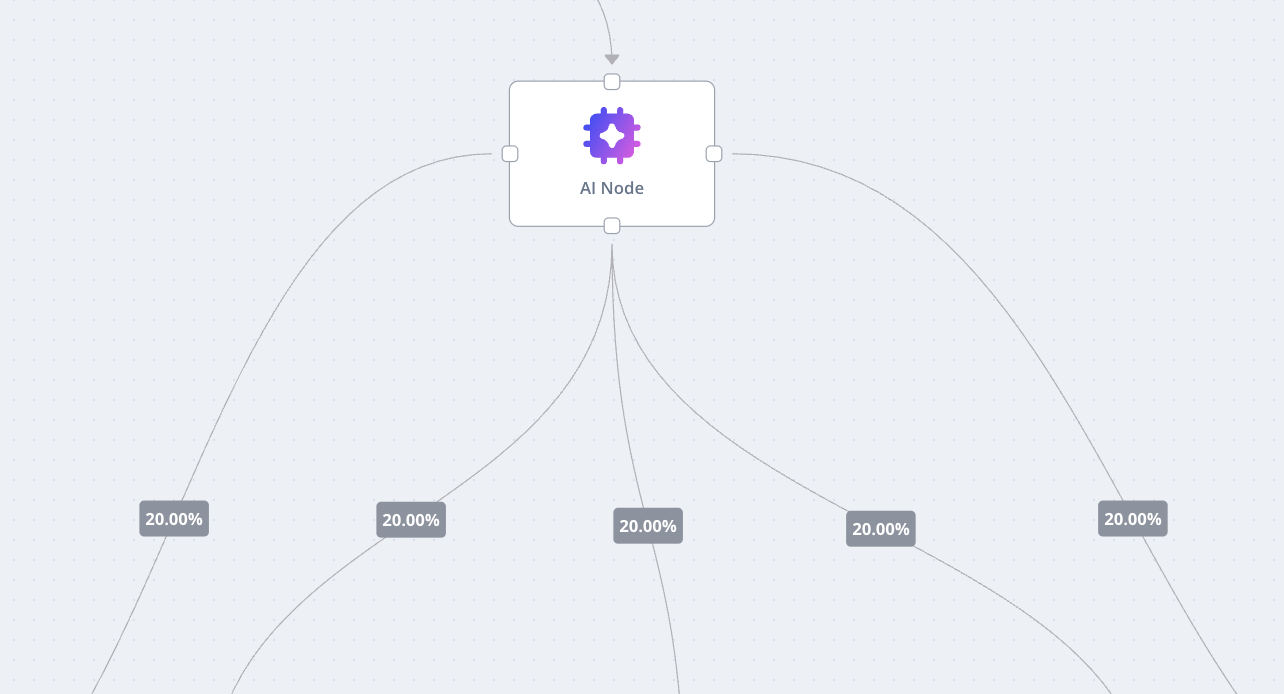
Once you have created one, treat it like a rotator. Connect incoming visitors to it, then connect out to your destinations:
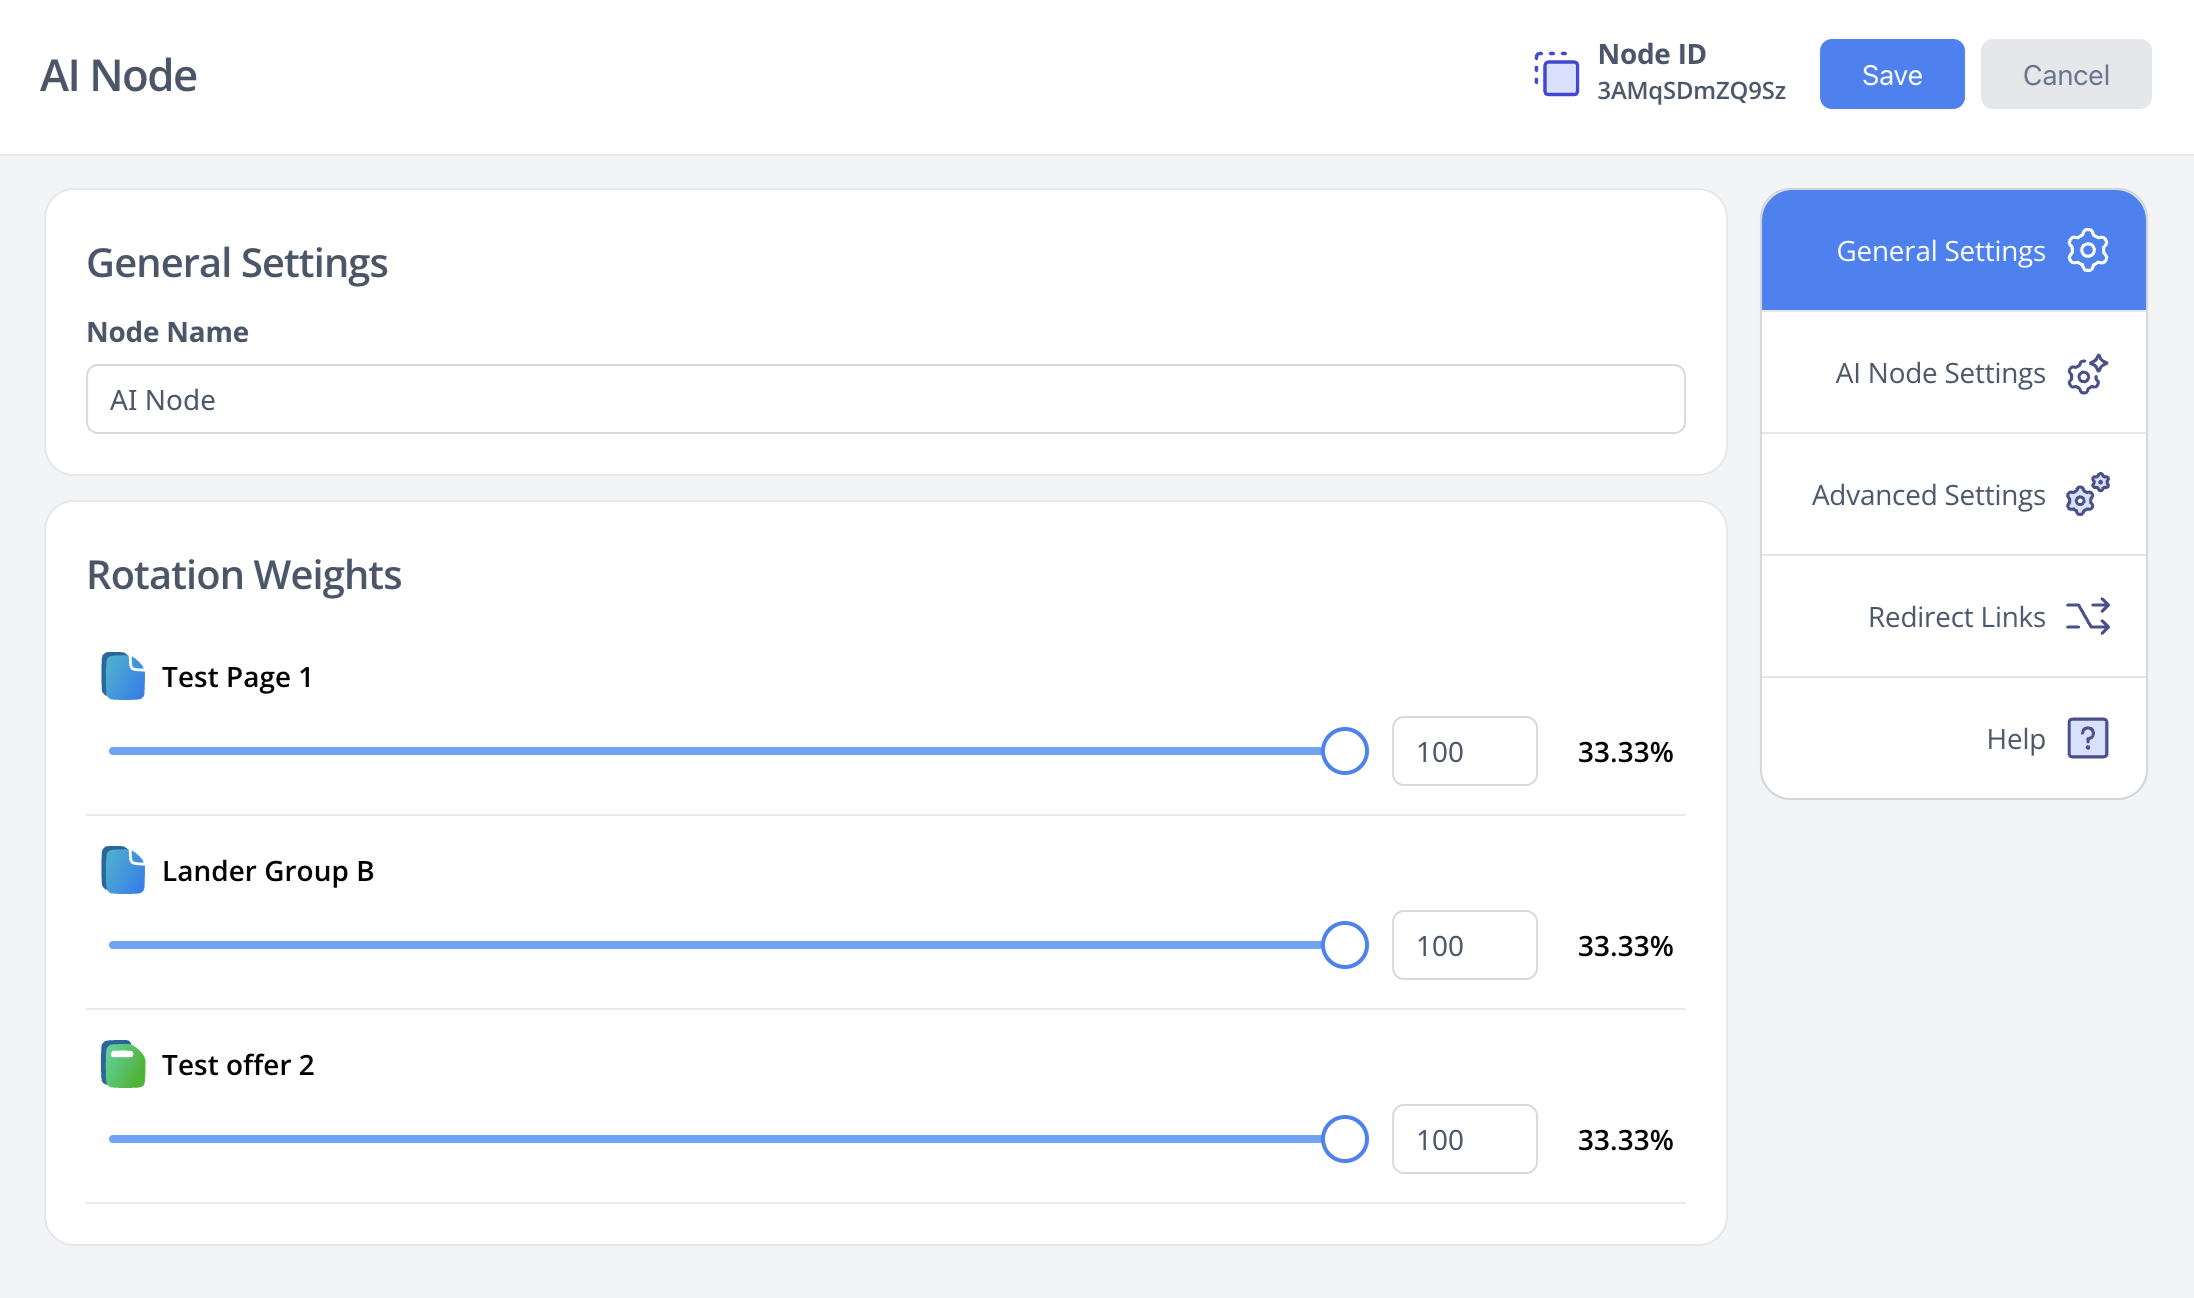
The first tab is exactly like a rotator:
Then, you can go to the AI node settings and advanced settings tab to configure how these AI nodes will process your data over time.
These nodes offer the most customisable intelligent routing of any performance marketing tracker, so there are quite a few settings you can use -- what works best depends on the volume and conversion behaviour of your traffic.
To start, we recommend just using the defaults
Basic AI node settings
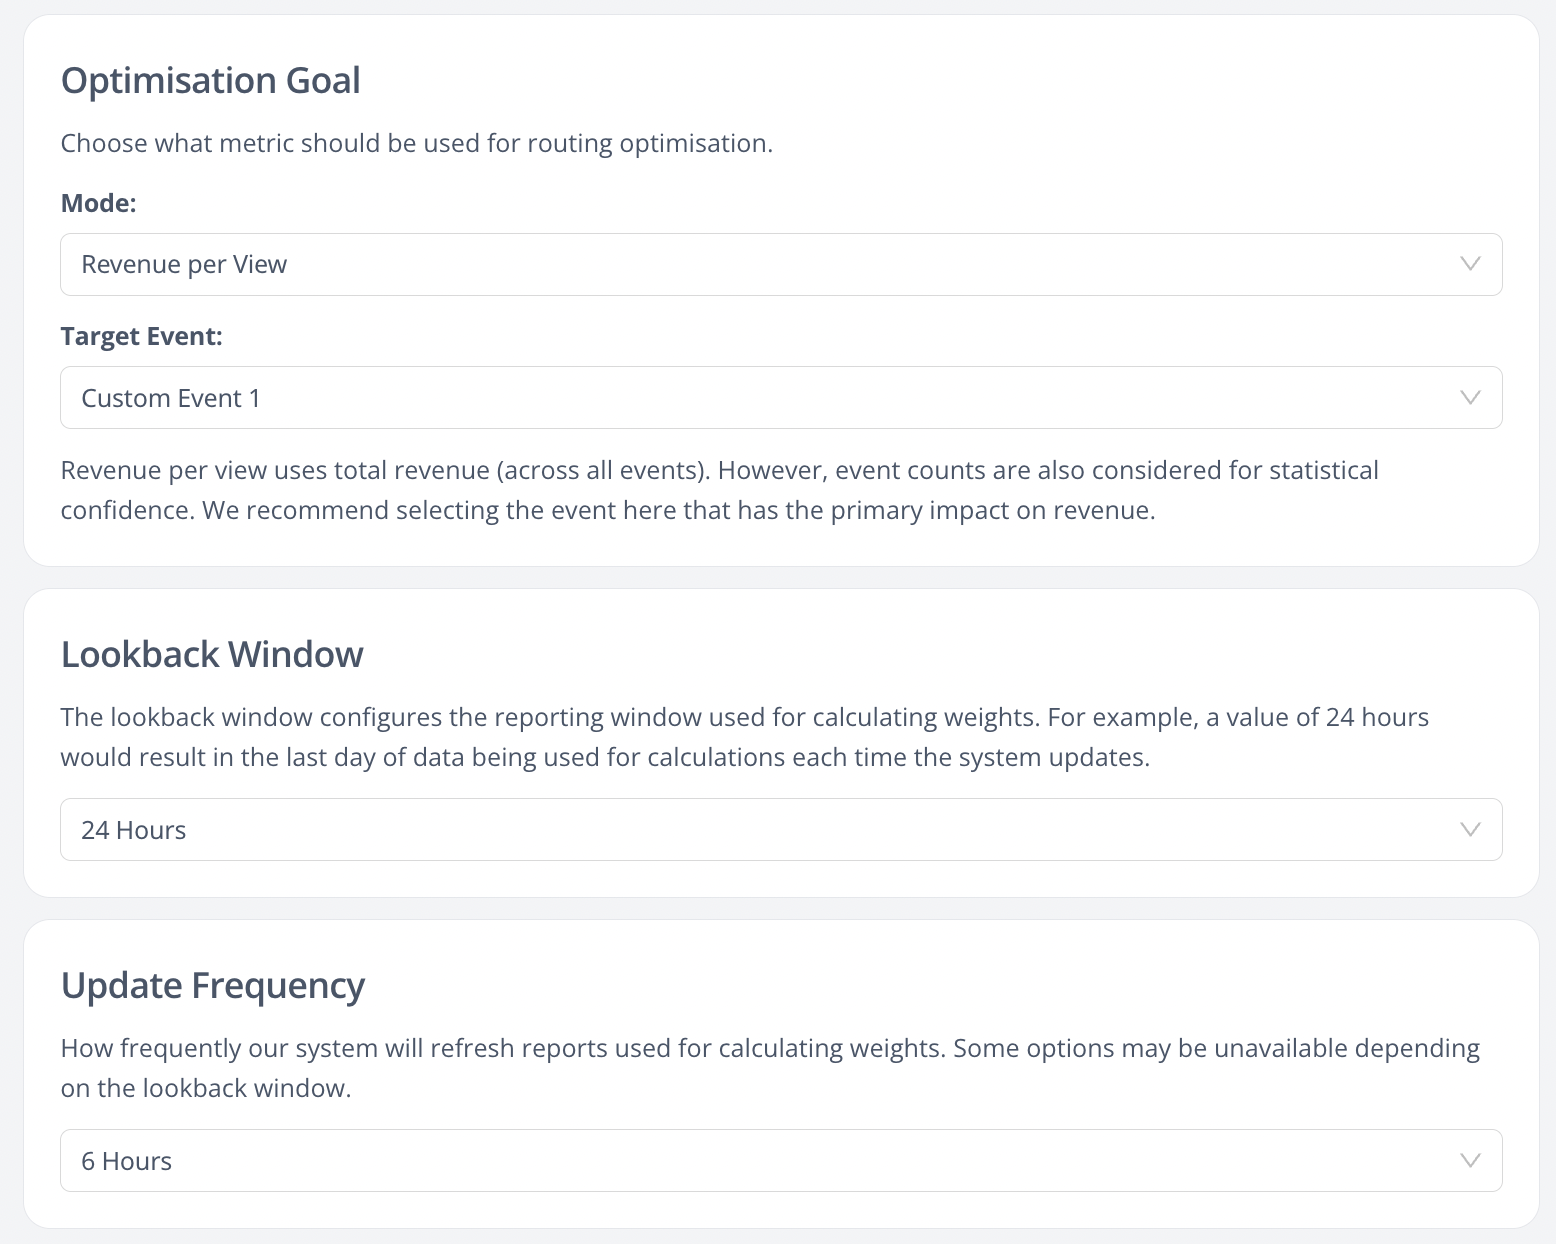
Here we can control how our AI nodes function. The most basic settings are what mode to use, how frequently it updates reports on your data (to determine routing percentages), and what past period it analyses:
There are two modes:
- Conversion rate
- Revenue per view
Conversion rate mode
When using conversion rate mode, the % routing to each destination will adapt based on the probability of each one being the best performer.
This is similar to what you will get from a split-test calculator like this one. Although, we have a lot more customisation and logic behind the scenes.
In this mode, you must pick the specific event to optimise toward. This is helpful when you may have early events like leads, but where revenue data is less available or slower (e.g. you want to optimise toward leads/signups first).
Revenue per view mode
The revenue per view mode uses total revenue (across all events) and is the default.
It will be the most effective in general situations where you have a reasonable number of conversions and revenue coming through.
With this mode, we optimise based on the monetary performance of each destination. This is not as simple as with the calculator above, so we have our own custom logic.
We do consider event counts even when using revenue per view -- we need to consider how many events create the revenue data (more events = more confidence), to prevent runaway winners, and to consider some of your other settings.
So on revenue per view mode, you should pick the event type that has the biggest impact on your revenue -- i.e. your primary revenue creating event.
Lookback Window
Choose a window with 10+ conversions to get a meaningful performance snapshot.
Use longer windows when:
- Campaign volume is low
- Performance varies significantly hour-to-hour or day-to-day
Frequency
Frequency controls how often the report refreshes. It must be equal to or less than your lookback window to avoid data gaps.
Use higher frequencies when:
- You have high volume and data flowing in quickly
- You want to optimize for real-time conversions rather than daily performance
- You're using highly algorithmic traffic sources
Note: Higher frequency options may be tied to your addon plan tier.
Segmentation
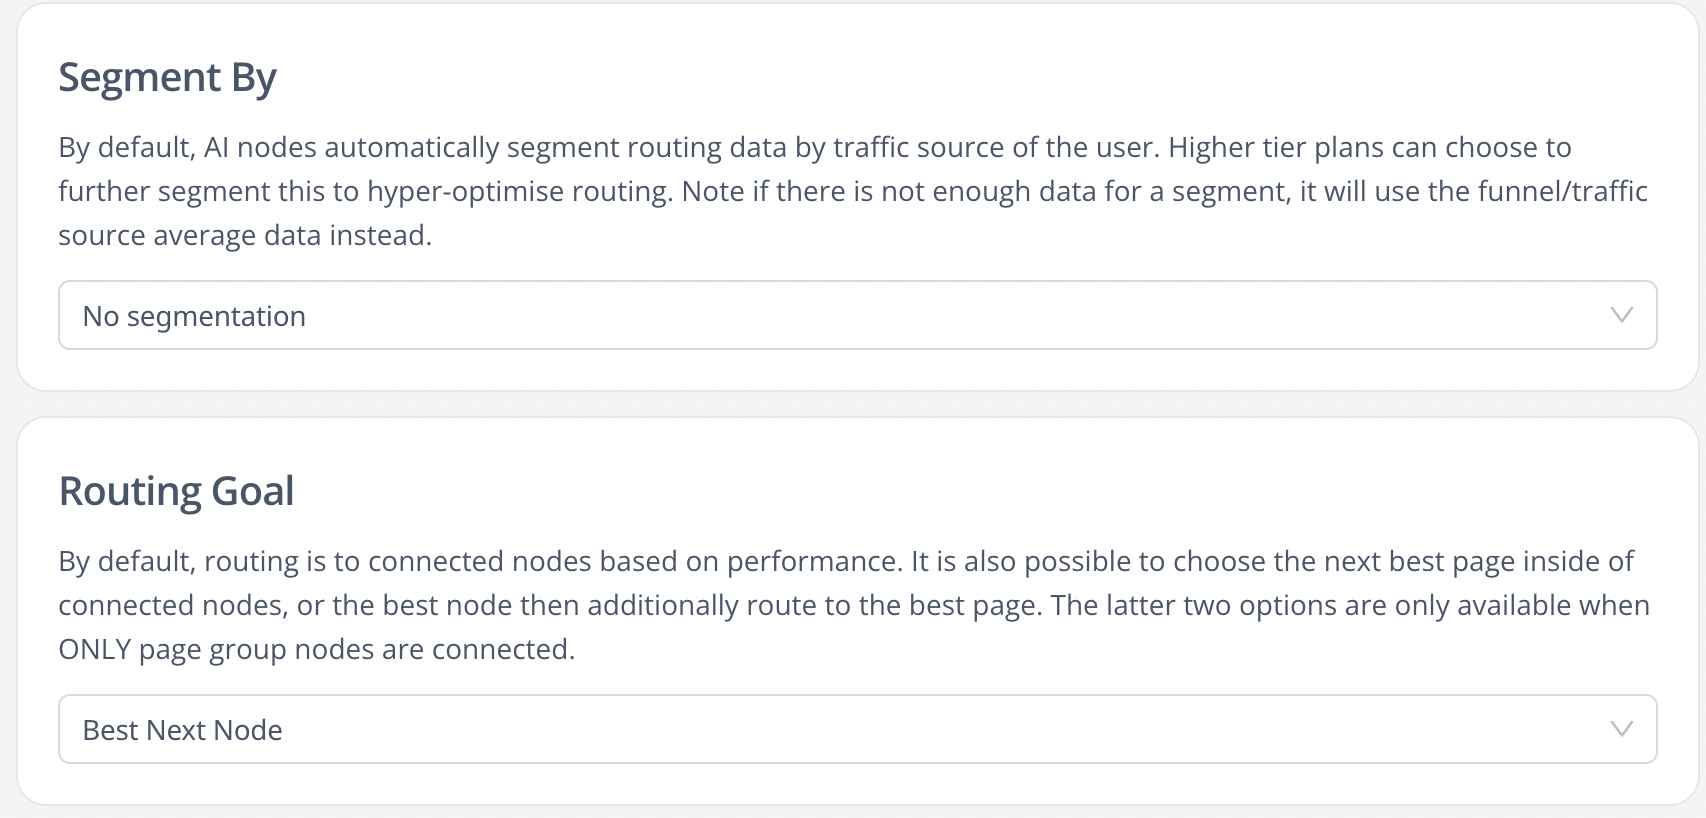
Segmentation affects how reports are broken into parts to further optimise your traffic.
By default, there is no segmentation.
The only current option is traffic source, which will split your reports by traffic source, creating optimised routing profiles for each.
Do this if you're running multiple sources to the same funnel and you think each traffic source may perform differently.
Note that when segmented we still do a report without segmentation to get a default profile for the funnel itself. If the current visitor is from some segment (e.g. traffic source X), but we don't yet have a routing profile for that -- due to a report not being run yet or a lack of data, we will use the funnel-level default. If that's not available, we will use the rotator's settings.
Routing goal
Next Best Node
- Routes to the best-performing connected node based on overall node data. Does not consider individual page performance within nodes.
Next Best Page
- Analyzes all pages across connected nodes and routes directly to the best-performing page, bypassing internal rotation settings. Best for most users when all connected nodes are page groups.
- Limitation: Cannot skip past non-page-group nodes (e.g., conditions) to reach pages.
Best Next Node → Best Page
- Two-step routing:
- Selects the best-performing node
- Then selects the best-performing page within that node
- Best for:
- Funnels with mixed node types (page groups + conditions, etc.)
- High page counts with limited data (e.g., 3 offer groups × 10 pages = 30 variants)
This mode provides more reliable early routing by first optimizing across fewer node-level variants, then refining within the selected node.
Advanced AI node settings
These settings are for advanced users who really want to tweak how their AI nodes function.
There's no need to touch these -- you can just use the defaults. Only adjust if you understand them and feel the need to.
We want to make these nodes simple to use, but have a lot of power under the hood to adapt to your needs.
Sensitivity factor
This determines who readily the system will allocate percentage routing to a higher performing variant (and vice versa, less to a lower performance variant).
You can think of it as a "fudge factor" that tries to pull all the values back to an average of equal amounts each.
At the lowest sensitivity, more data and stastical confidence is required for it to drive more traffic to the higher peformers.
At the highest sensitivity, even at low conversion counts (e.g. 5-10 conversions across all nodes), it may rapidly allocate >90% of traffic to the variant with the best performance.
Be careful adjusting this as it can cause runaway performance on a single variant. We do not recommend adjusting it to higher sensitivity unless you have >50 conversions across all your variants in your lookback window.
Cap variant percentage
This feature is optional and quite simple -- it will set a limit on the % weight that can go to any variant.
This can prevent runaway spend and help with fair testing.
Minimum percentage per variant
Similar to the setting above, this will try to send a minimum % to every variant available (depending on the routing mode).
This can ensure fair testing of all variants.
If the mimimum % is greater than the average, it will use the average. For example if you set a minimum of 10% but you have 15 variant destinations, it will use 1/15 weight to each of them.
As with the exploration weight feature, this helps all variants get traffic including those with low performance, those recently added, and those with zero data. Because of this, it's important that you regularly audit your AI node/funnel performance and remove any variants that you no longer want to test.
FAQ
What frequency and lookback window should I use?
Firstly, the available options may depend on the AI node plan you pay for. Greater frequencies and segmentation may require a higher tier plan.
In general, choose a window where you believe you will have adequate data to assess performance, and a frequency based on how much traffic you send > how fast you can get that data.
If you are sending 100 clicks a day from Google Ads and expect a few conversions, you can likely select last 7 days for the report and update every 24 hours. This way it will assess performance every day and look back over a significant period.
If you are sending pop traffic and get tens of thousands of views an hour, and dozens of hourly conversions, you can update more frequently and can use a shorter window e.g. 24 hours.
If you run on highly algorithmic sources where you get a lot of incoming visitors/conversions AND want to optimise quite rapdily, you may want to use our fastest report frequency and a short lookback window (e.g. hourly and look back on the past 3-6 hours).
It really depends on the situation, and what plan may be applicable. The more rapid frequencies and segmentation options will require higher plans, given the much higher loads they can put on our reporting systems.
What segmentation options are available?
Right now we have default (none) and by traffic source.
In the future we plan to add campaign ID, country, and possibly URL tracking fields but with a limit based on the top segments (e.g. by ad ID but limited to the top 100 values by visit count).
We are still developing this and need to test with more real-world data. These tighter segmentations will require a lot more traffic to work well, will require a higher plan, and will have some limitations to prevent abnormal load on our systems.
If I don't have data yet, what will the AI node do?
In this case, the node will just use the rotator settings. It's still a fully functional rotator and acts like one. It's just that if data is available, it will create and use optimised routing profiles.
Can I see the routing % data?
Not right now, but we plan to add this to the UI in the future
If I segment by something and there's not enough data yet, what will it do?
If no active segment data exists (no report has run yet or not enough data confidence), the node will use the default (non-segmented) report, and if that's not available, then it will use the default rotator settings.