In this article I'll outline our "flow" metrics, which we have created to make it easier to understand user journeys through funnels and conversion rates within visitor journey reports.
These metrics are available on the reporting page only under the Flow Metrics tab:
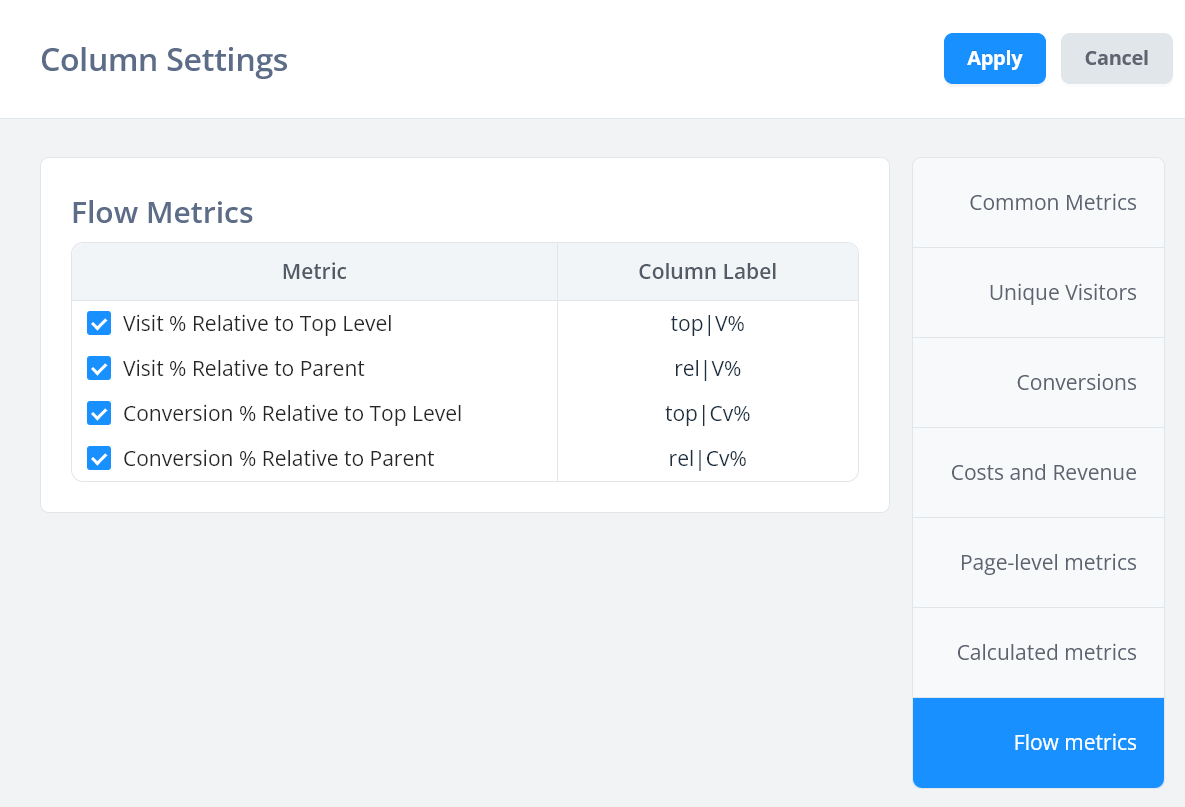
These metrics have two types -- top level and parent.
The "Top" level is the first level row in the tree, whereas parent means the row immediately above the current one in the tree.
Calculated visit flow metrics
Here we have two metrics - top|V% and rel|V%
These take the visit count in the current row, then divide by either the visit count in the most parent row (top), or the one immediately above:
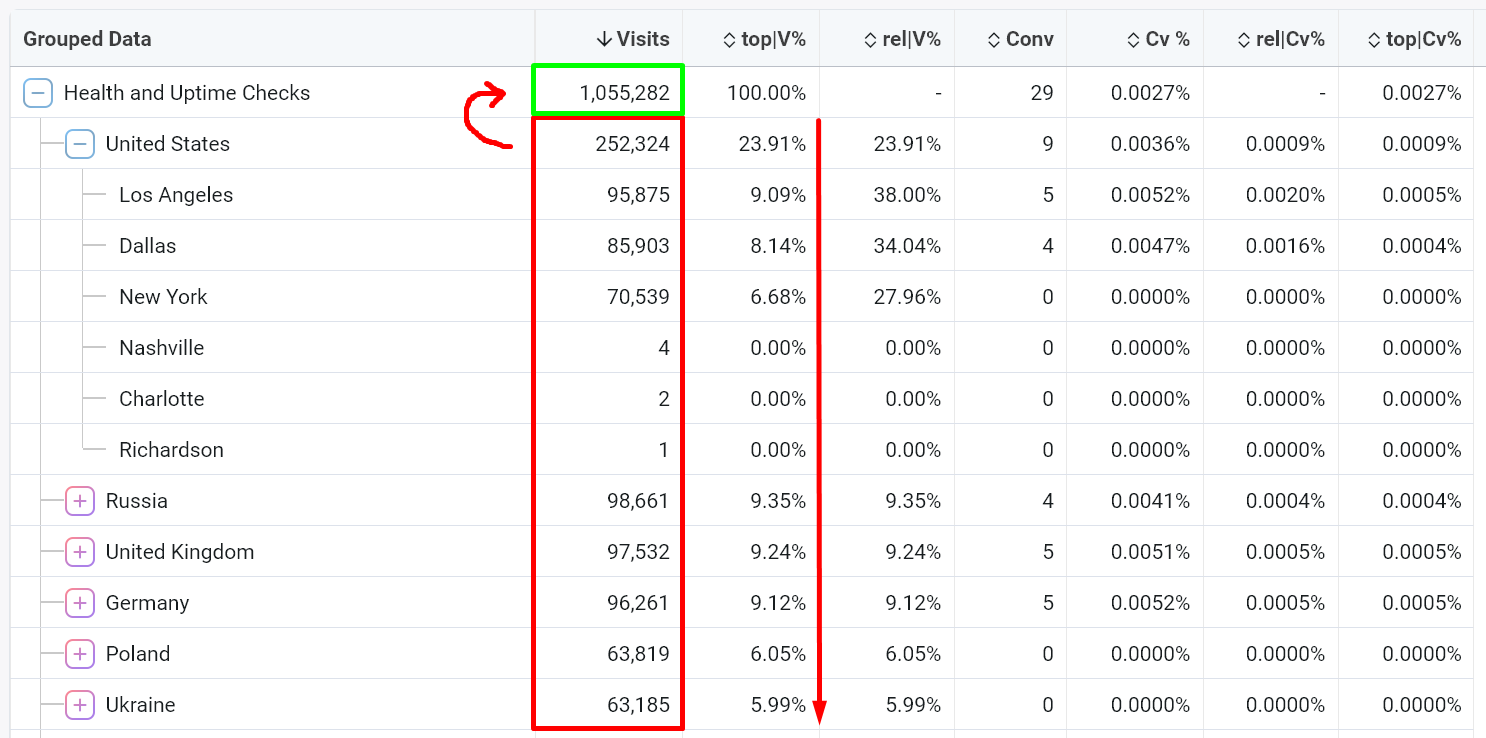
Here the top|V% metric is showing the % of visits that get to each lower level. This allows you to understand what percentage of visits (so, approximately visitors), get to each level of your tree, and easy breakdown of what total % of these visits are from countries, cities, devices etc. -- whatever you may be breaking down by.
On the other hand, rel|V% is dividing by the immediate parent. For second-level data, this will be the same as top|V%. But for each deeper item in the tree it will show the relative breakdown of visits:
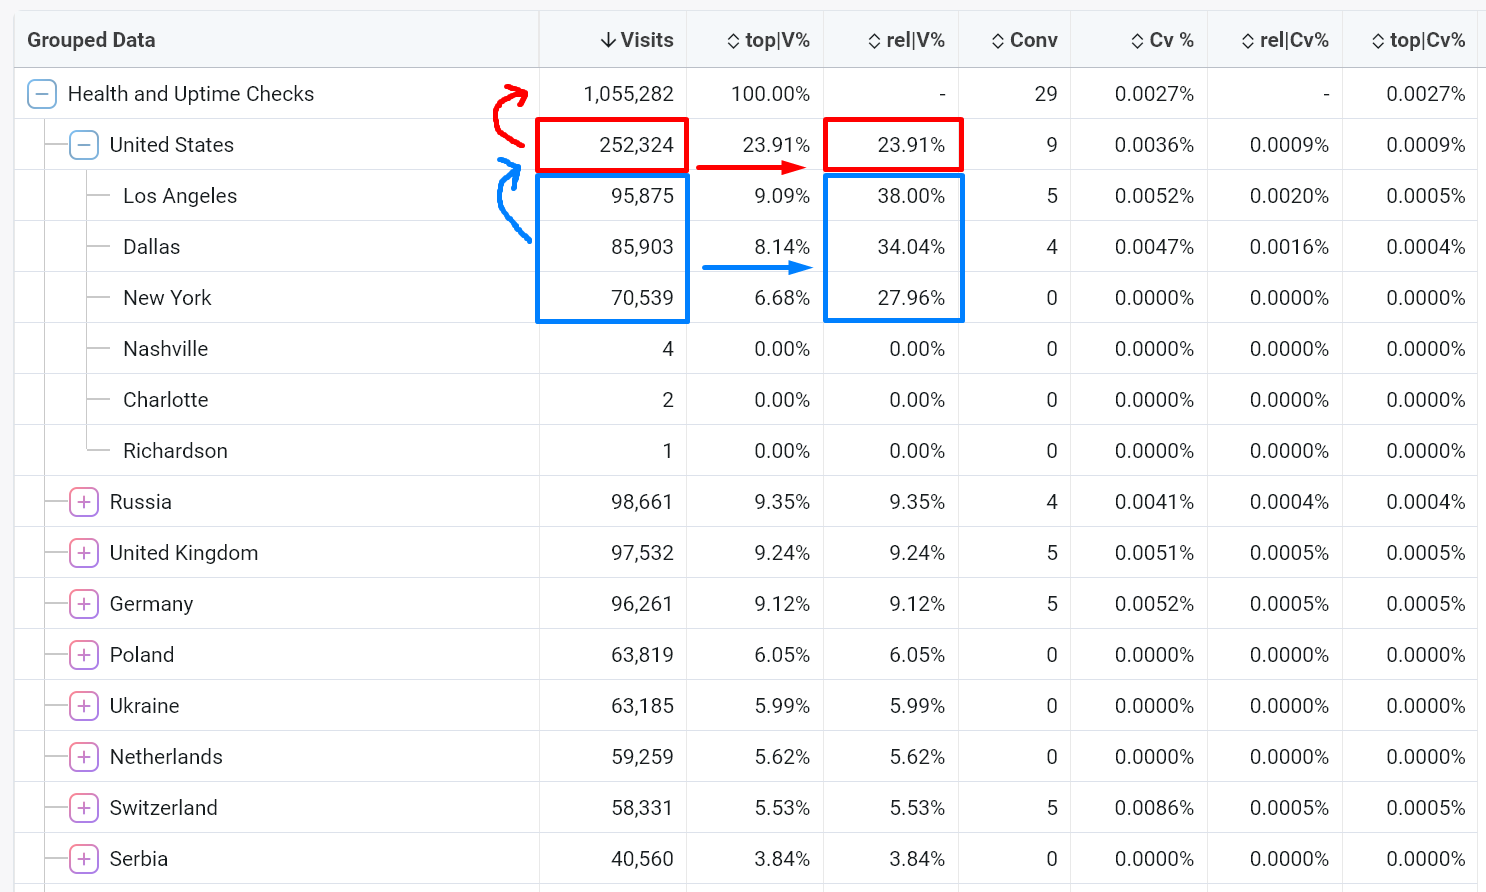
Here for example, it allows us to understand what percentage of US users were from each city.
Within visitor journeys, this will allow you to understand what percentage of users clicked from page A > arrived on page B, for example.
Calculated conversion flow metrics
These metrics are likely more useful and powerful for you when looking at conversion rates.
We have three key conversion rates to consider here -- normal Cv%, top|Cv% and rel|Cv%.
These will tell you the conversion rate for that specific row, relative to the top of the tree, and relative to the immediate parent, respectively. Let's show these with image examples.
Normal conversion rate
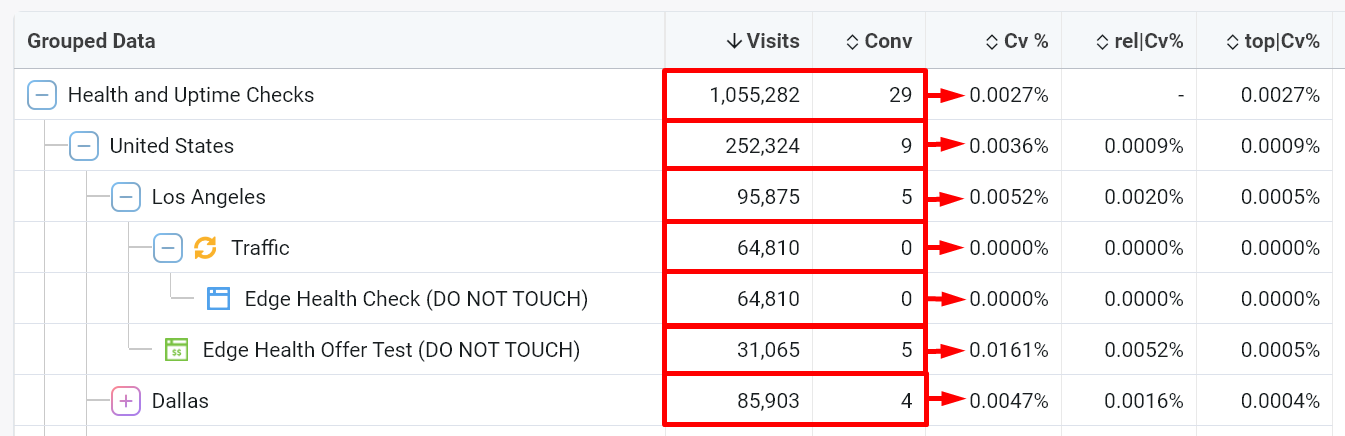
This metric is "Conversion per Visits" or Cv% and is located outside of flow metrics -- in the common metrics and calculated metrics tab.
This metric takes the conversion count in the current row then divides it by the visit count in that row. So, it will show the specific conversion rate of an attribute -- whether it be country, funnel, or a specific page inside visitor journey.
This is useful in many ways, but it doesn't let you see the overall conversion rate for some page/offer, based on how much traffic to the entire funnel, or from a specific traffic source.
Conversion rate relative to top level
This metric has the column header top|Cv% and takes the conversions in the current row, divided by the top most row in the tree.
This allows you to see the "end to end" conversion rate on some page relative to how many visitors are in that segment (e.g. funnel or traffic source), as below:
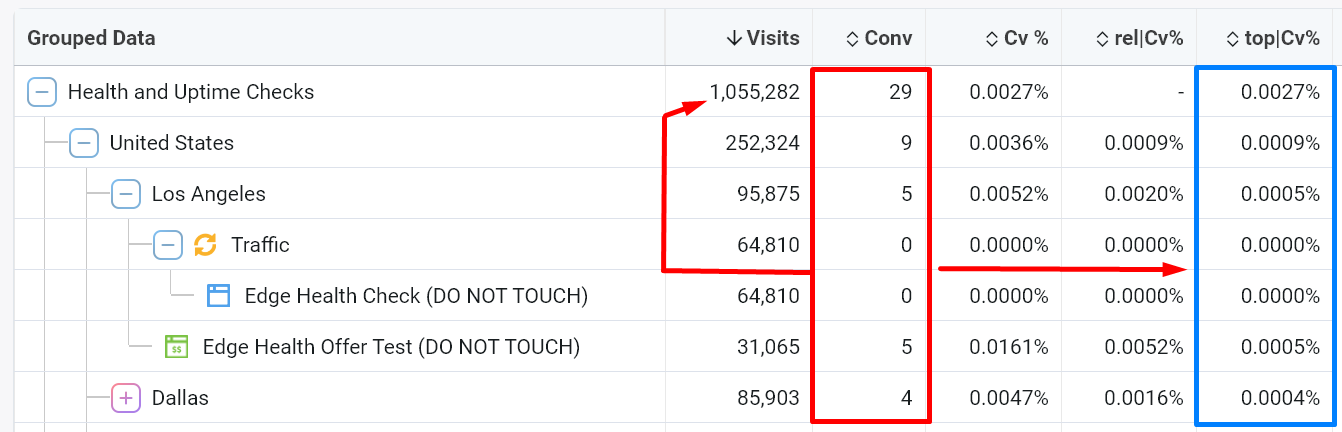
The conversion rates here are much lower than the Cv% above, as the top level row would always have equal to or more than any child row.
Conversion rate relative to parent
This metric has the column header rel|Cv% and it uses the visit count of the immediate parent row in the tree.
The calculations can be a little complex to show in an image (since every row is dividing by a different parent), but hopefully you get the idea:
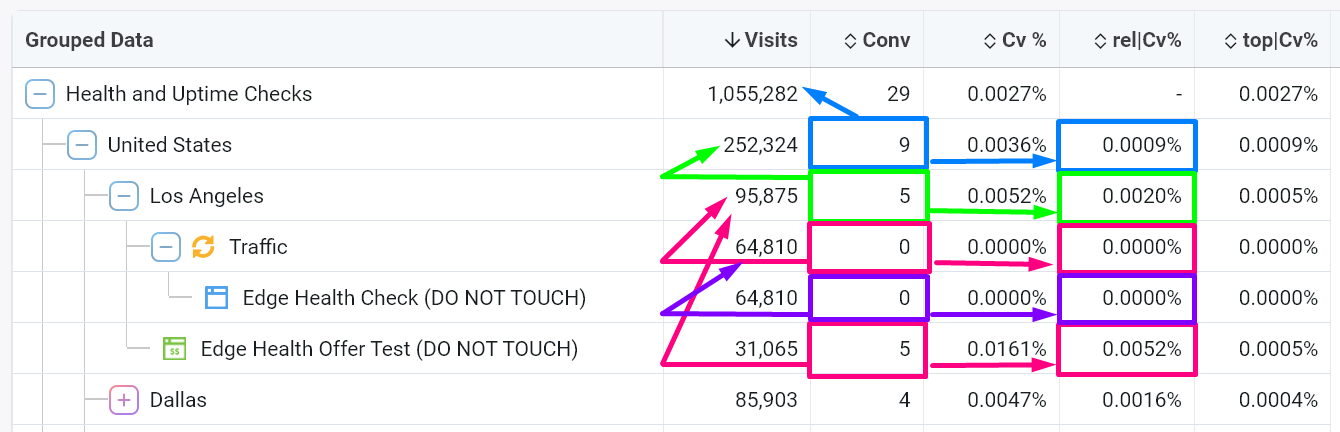
This metric is particularly important when looking at visitor journey reporting, as it allows you to see offer conversion rates relative to a parent landing page.
In this way, you can see how the conversion rate of the same offer may vary depending on the previous lander.
Hopefully you'll find these metrics helpful! We know reporting can be quite complex and so many metrics can be overwhelming, so it's important to find the metrics most useful to your situation and focus on those.
If you have any questions or find times where these metrics aren't displaying correctly, please reach out to our support.