

The Raw Events page allows you to pull reports on raw hit data.
Hits are the name for our events that are produced with every node visit by a user. As someone traverses a funnel they have a single visitor (session) ID but create a new hit ID at every node.
It is these Hits that form the raw data in our system, are what get converted when conversions happen, and ultimately tie everything together.
Accessing raw data is demanding, so you can only access it and attributes like external IDs, IP and user-agent, from the Raw Events section.
Additionally you are limited to a maximum of 15 columns of data and 10,000 rows.
To pull a report, just pick the date range and event type then hit load data:
To filter to specific funnels, traffic sources, countries etc., click the green filter button next to load data.
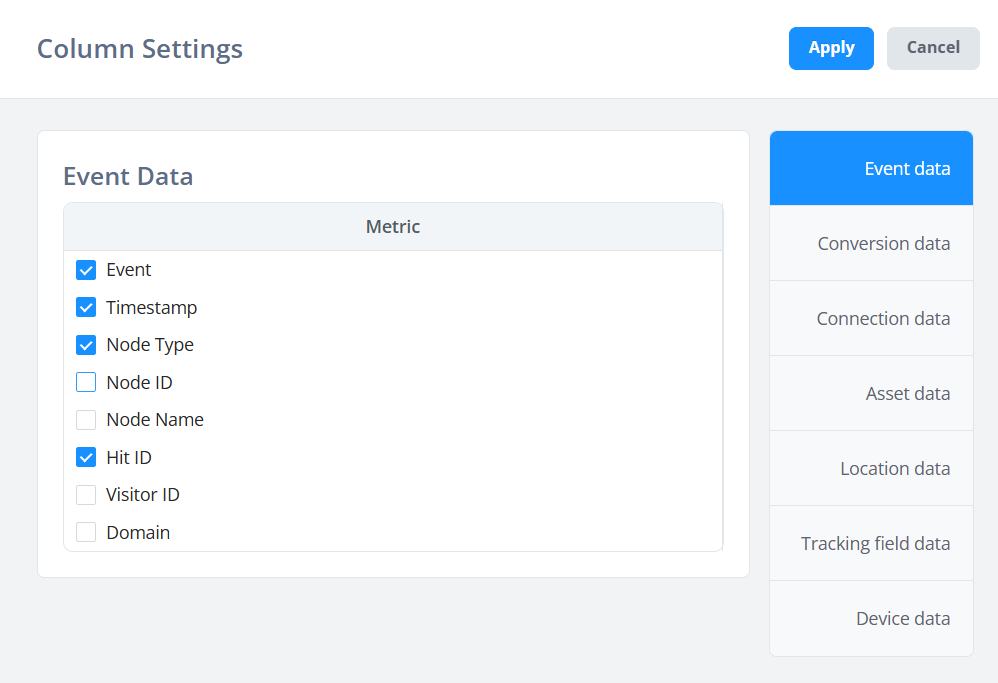
To show specific columns, click the column button in the table footer:

From here, you can select URL tracking fields and important data like timestamps, hit IDs, etc.
In general we would recommend having these 4 important columns as your first ones to make data clearer:
Understanding the data
Raw data can be a bit confusing to understand if you're not familiar with it.
Each row is an event (such as a hit) and you can then see a lot of additional data that is not available in regular reporting -- like the hit/session IDs, user-agent, timestamp, etc.
Here for example, I can see the hits being generated by one of our uptime monitors:
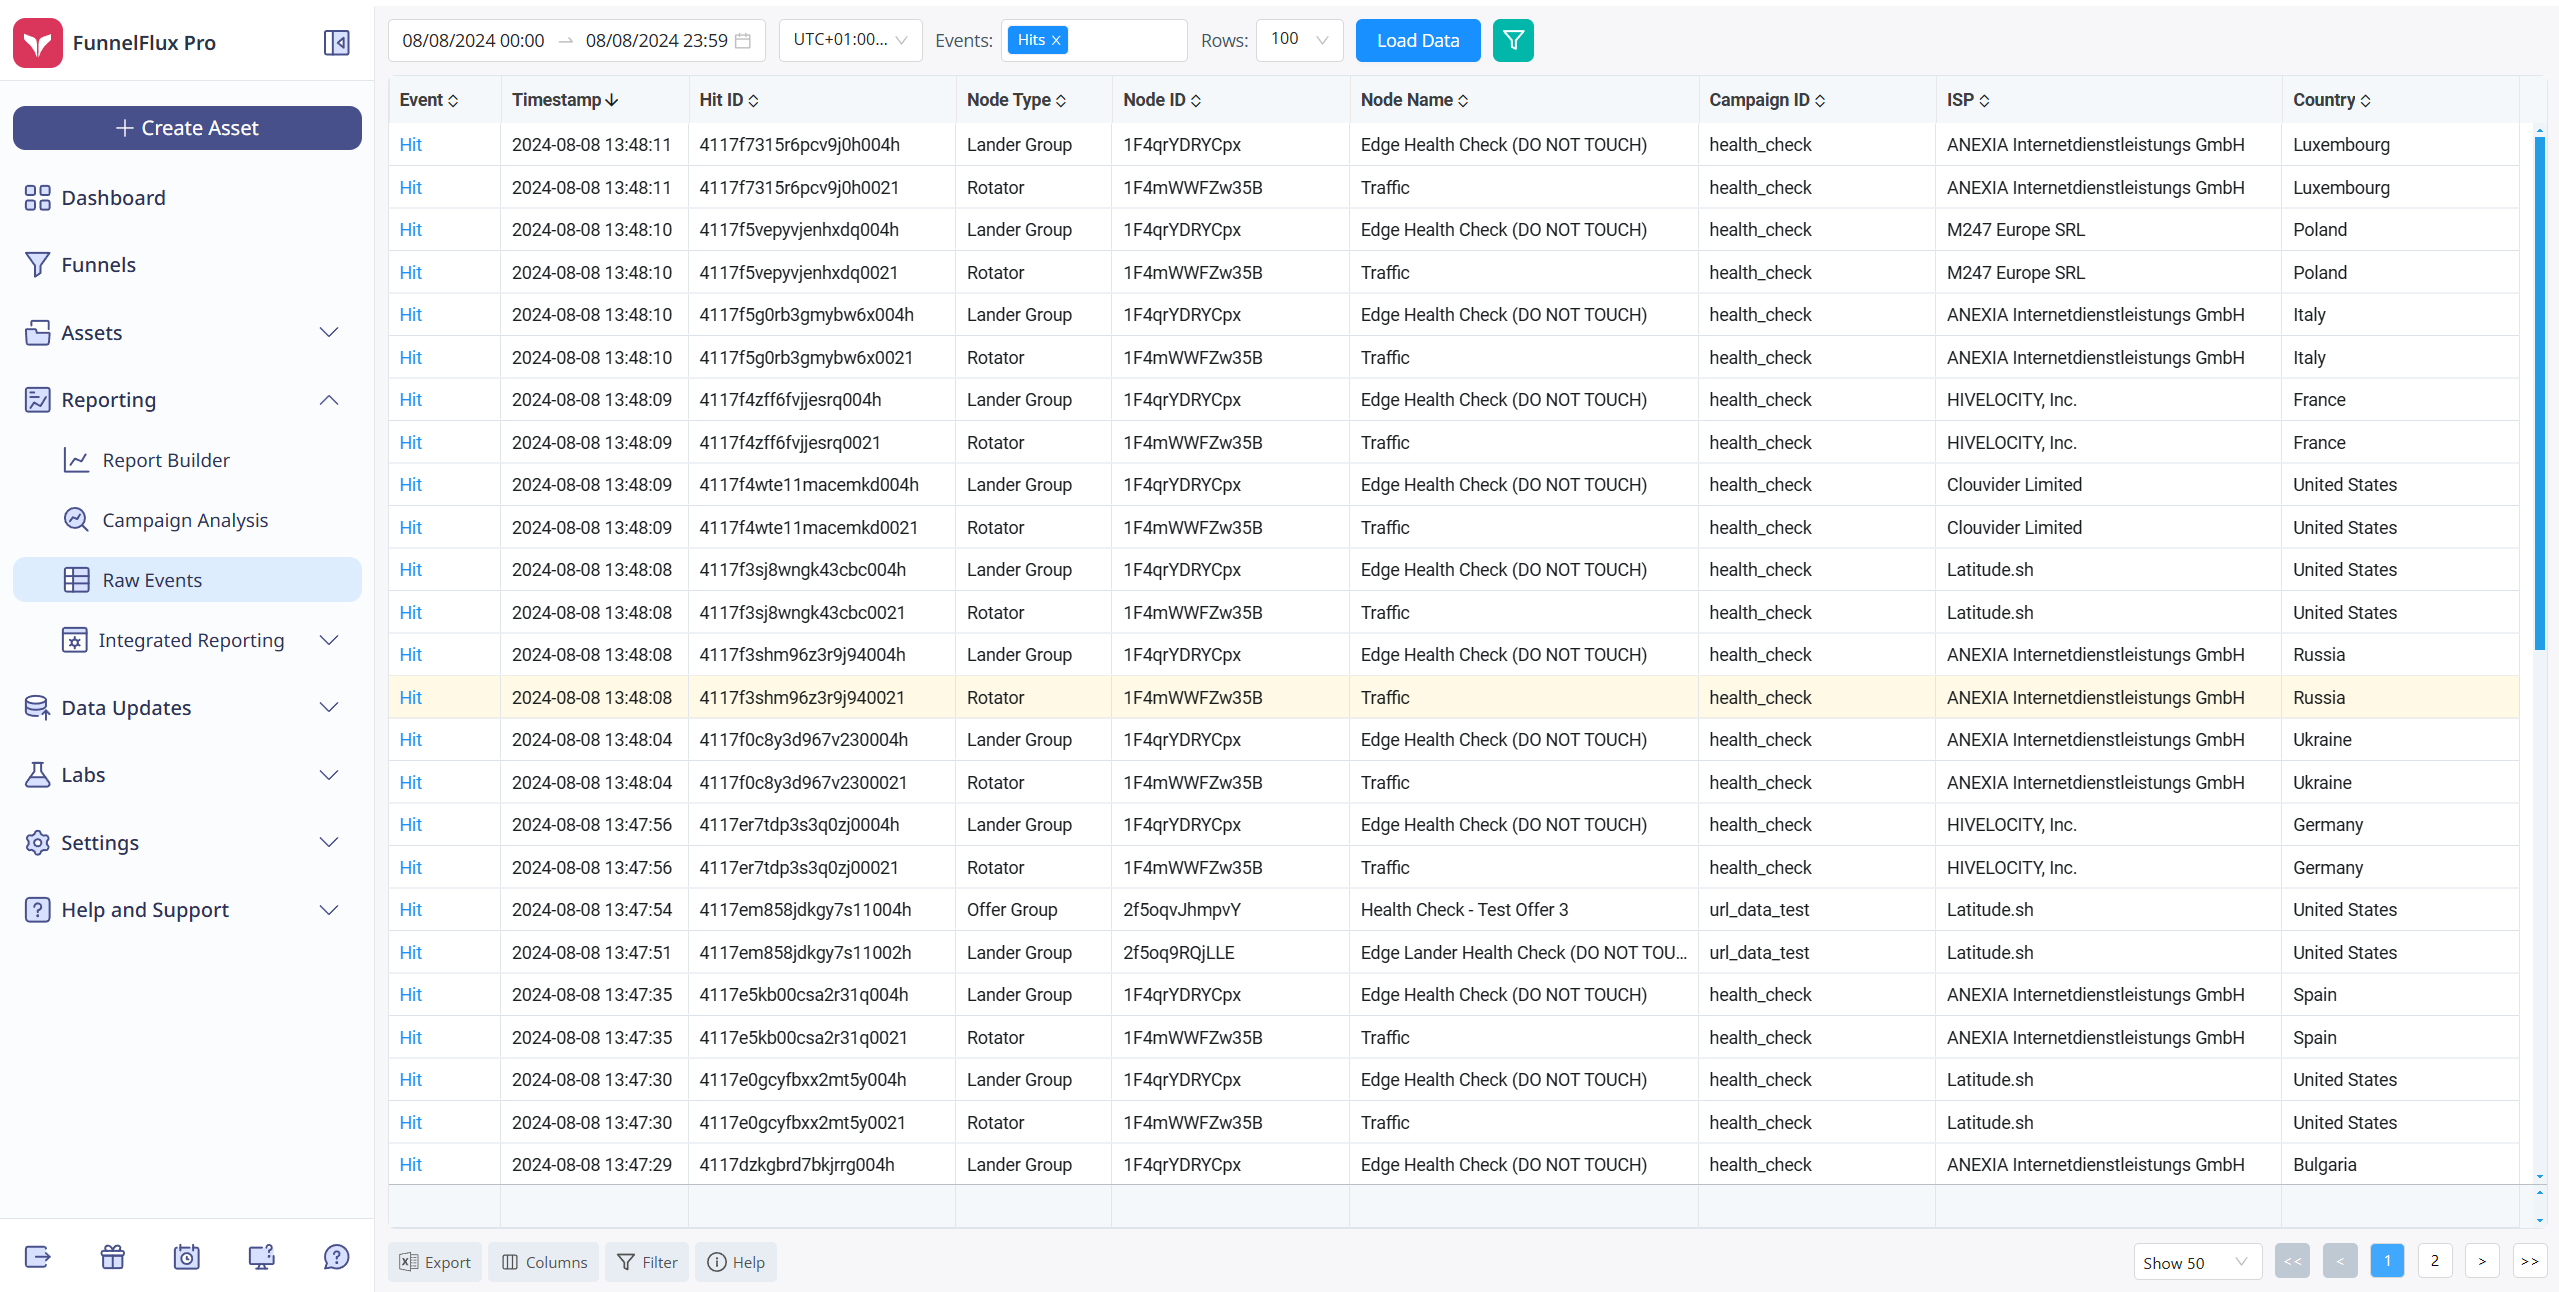
See how there is a visit to a node type "rotator" then "lander group"? This is because our link loads the traffic node, which then routes to a lander. Each one of these nodes creates its own unique hit.
For typical traffic, you will likely want to show campaign, external and tracking field IDs, and could show funnel/traffic source ID or alternatively filter to specific ones in the filter menu.
Useful ways to debug with raw data
There are many situations where this data is helpful.
Without going into great detail, here are a few:
- Checking incoming visits from a traffic source to see if they have external IDs -- without these click IDs being passed, conversion tracking to that source likely won't work
- Checking incoming visits to see if they have the correct traffic source. If using direct linking and things come up as organic, you may not be using the correct link
- Checking if clicks become change traffic source to organic - this indicates a tracking disconnect and means if they later convert, they won't be under the correct source
- Checking suspicious clicks/visits to see if they share a common user-agent or IP
- Looking through your own test data to see if every page hit, click and conversion is logged as expected
- Checking conversions to see if they have expected transaction IDs and revenue. In normal reporting you can't show each conversion as its own row, whereas here you can