

The Campaign Analysis page is a dedicated reporting view for analysing "campaigns".
What is a campaign? It's the value passed under the campaign field in tracking links.
If you go to any traffic source and edit the tracking fields, you will see this:
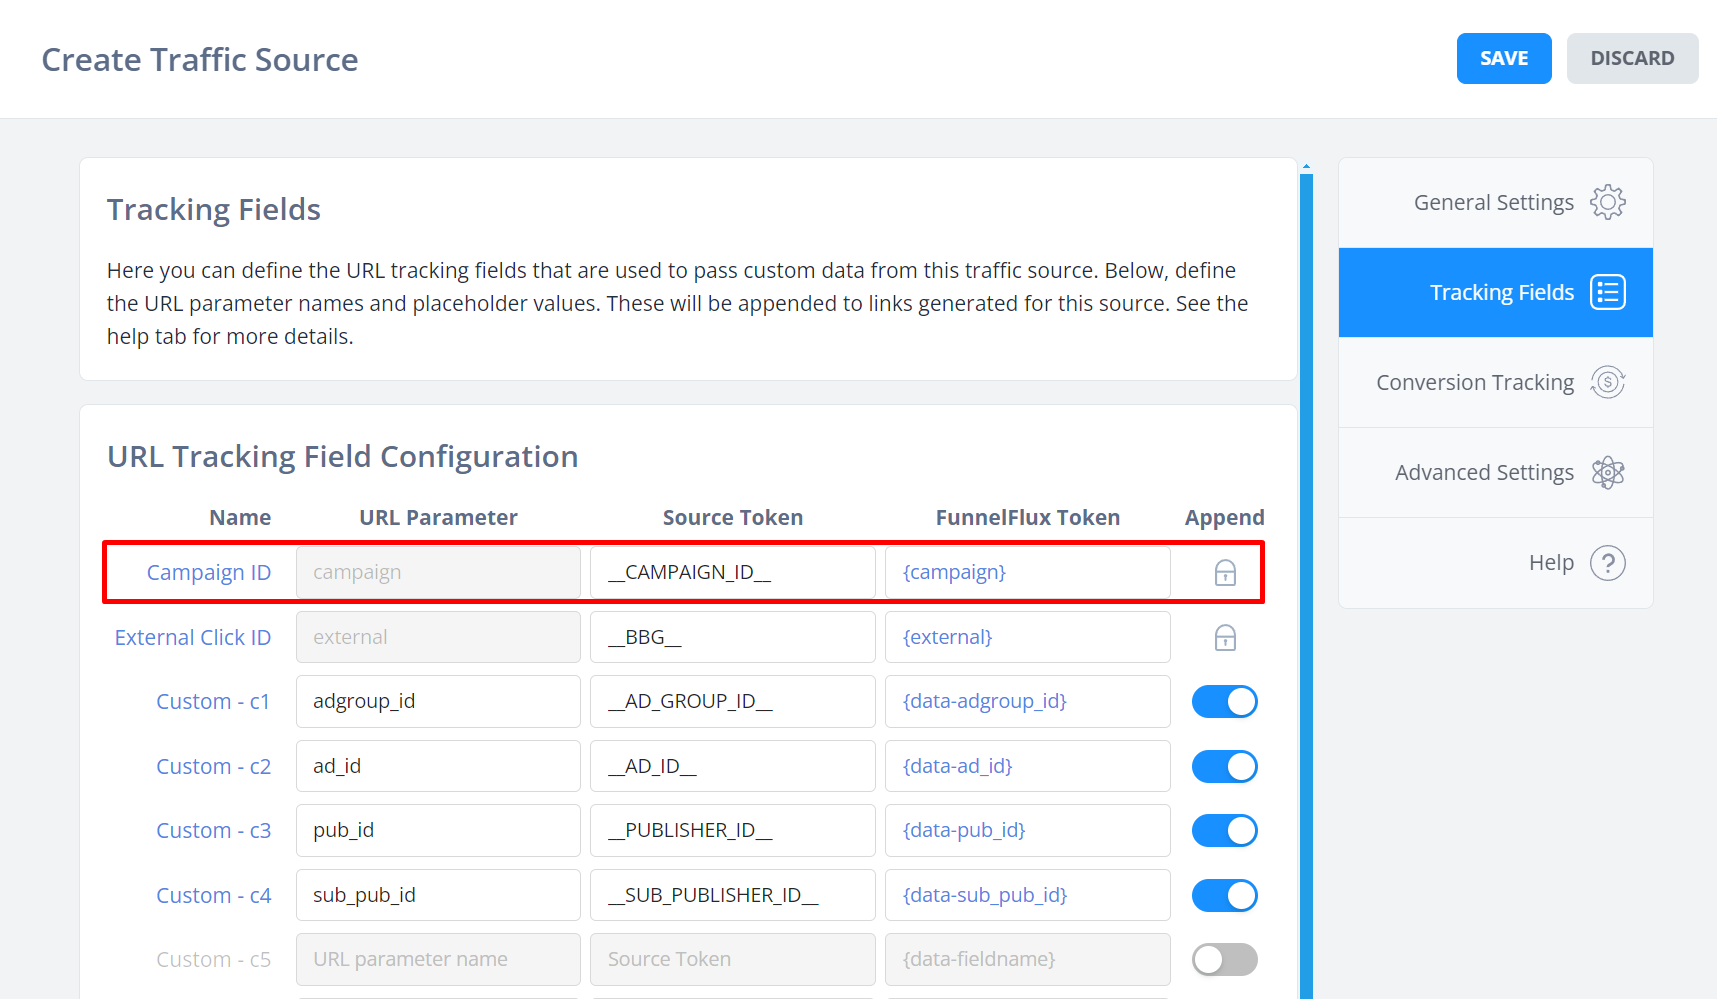
In your links this will result in ...&campaign={campaignid}... which will ultimately pass some real ID value for a live campaign.
It's these ID (or name, depending on the token you use) values that are shown under the "Campaign" attribute in reporting, and as each row in the Campaign Analysis page.
Why does this page exist?
In FunnelFlux we use funnels.
Each funnel can receive traffic from an unlimited number of traffic sources, campaigns, ads etc.
But when it comes to optimisation, quite often you'll be thinking of your individual campaign performance on the traffic source side. After all, traffic sources all generally make you create "campaigns".
We want everything to be dynamic, so you don't need to create these in FunnelFlux, rather just pass them as a value in URLs.
But then to break down by these, you will quite often need to group by funnel > traffic source > campaign, at a minimum, to make sense of the data.
This is a lot of prep work in the reporting section just to look at a specific campaign's data.
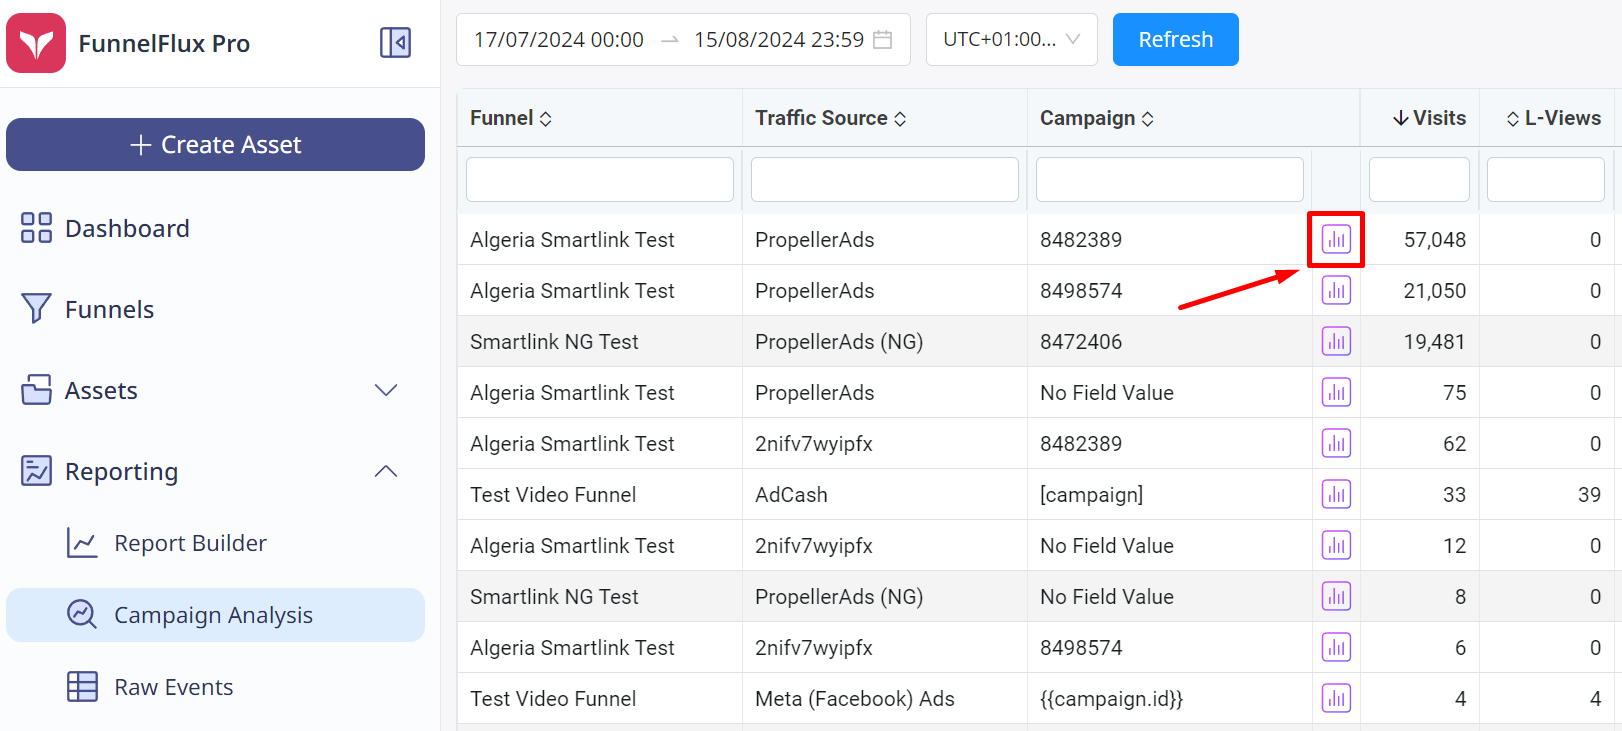
So, the Campaign Analysis page shows these by default, in a simple/fast flat view, making it easy to use inline filters and ROI highlighting.
You can then click the Quickstats icon to drill down into each individual campaign.
How is this page different?
Glad you asked!
On the Campaigns Analysis page, unlike other pages, we have removed a lot of extras and set sensible defaults to make your analysis faster and easier:
- The report only requires time/timezone and loads columns of funnel, traffic source and campaign
- Inline filtering and ROI colour coding are forced on by default
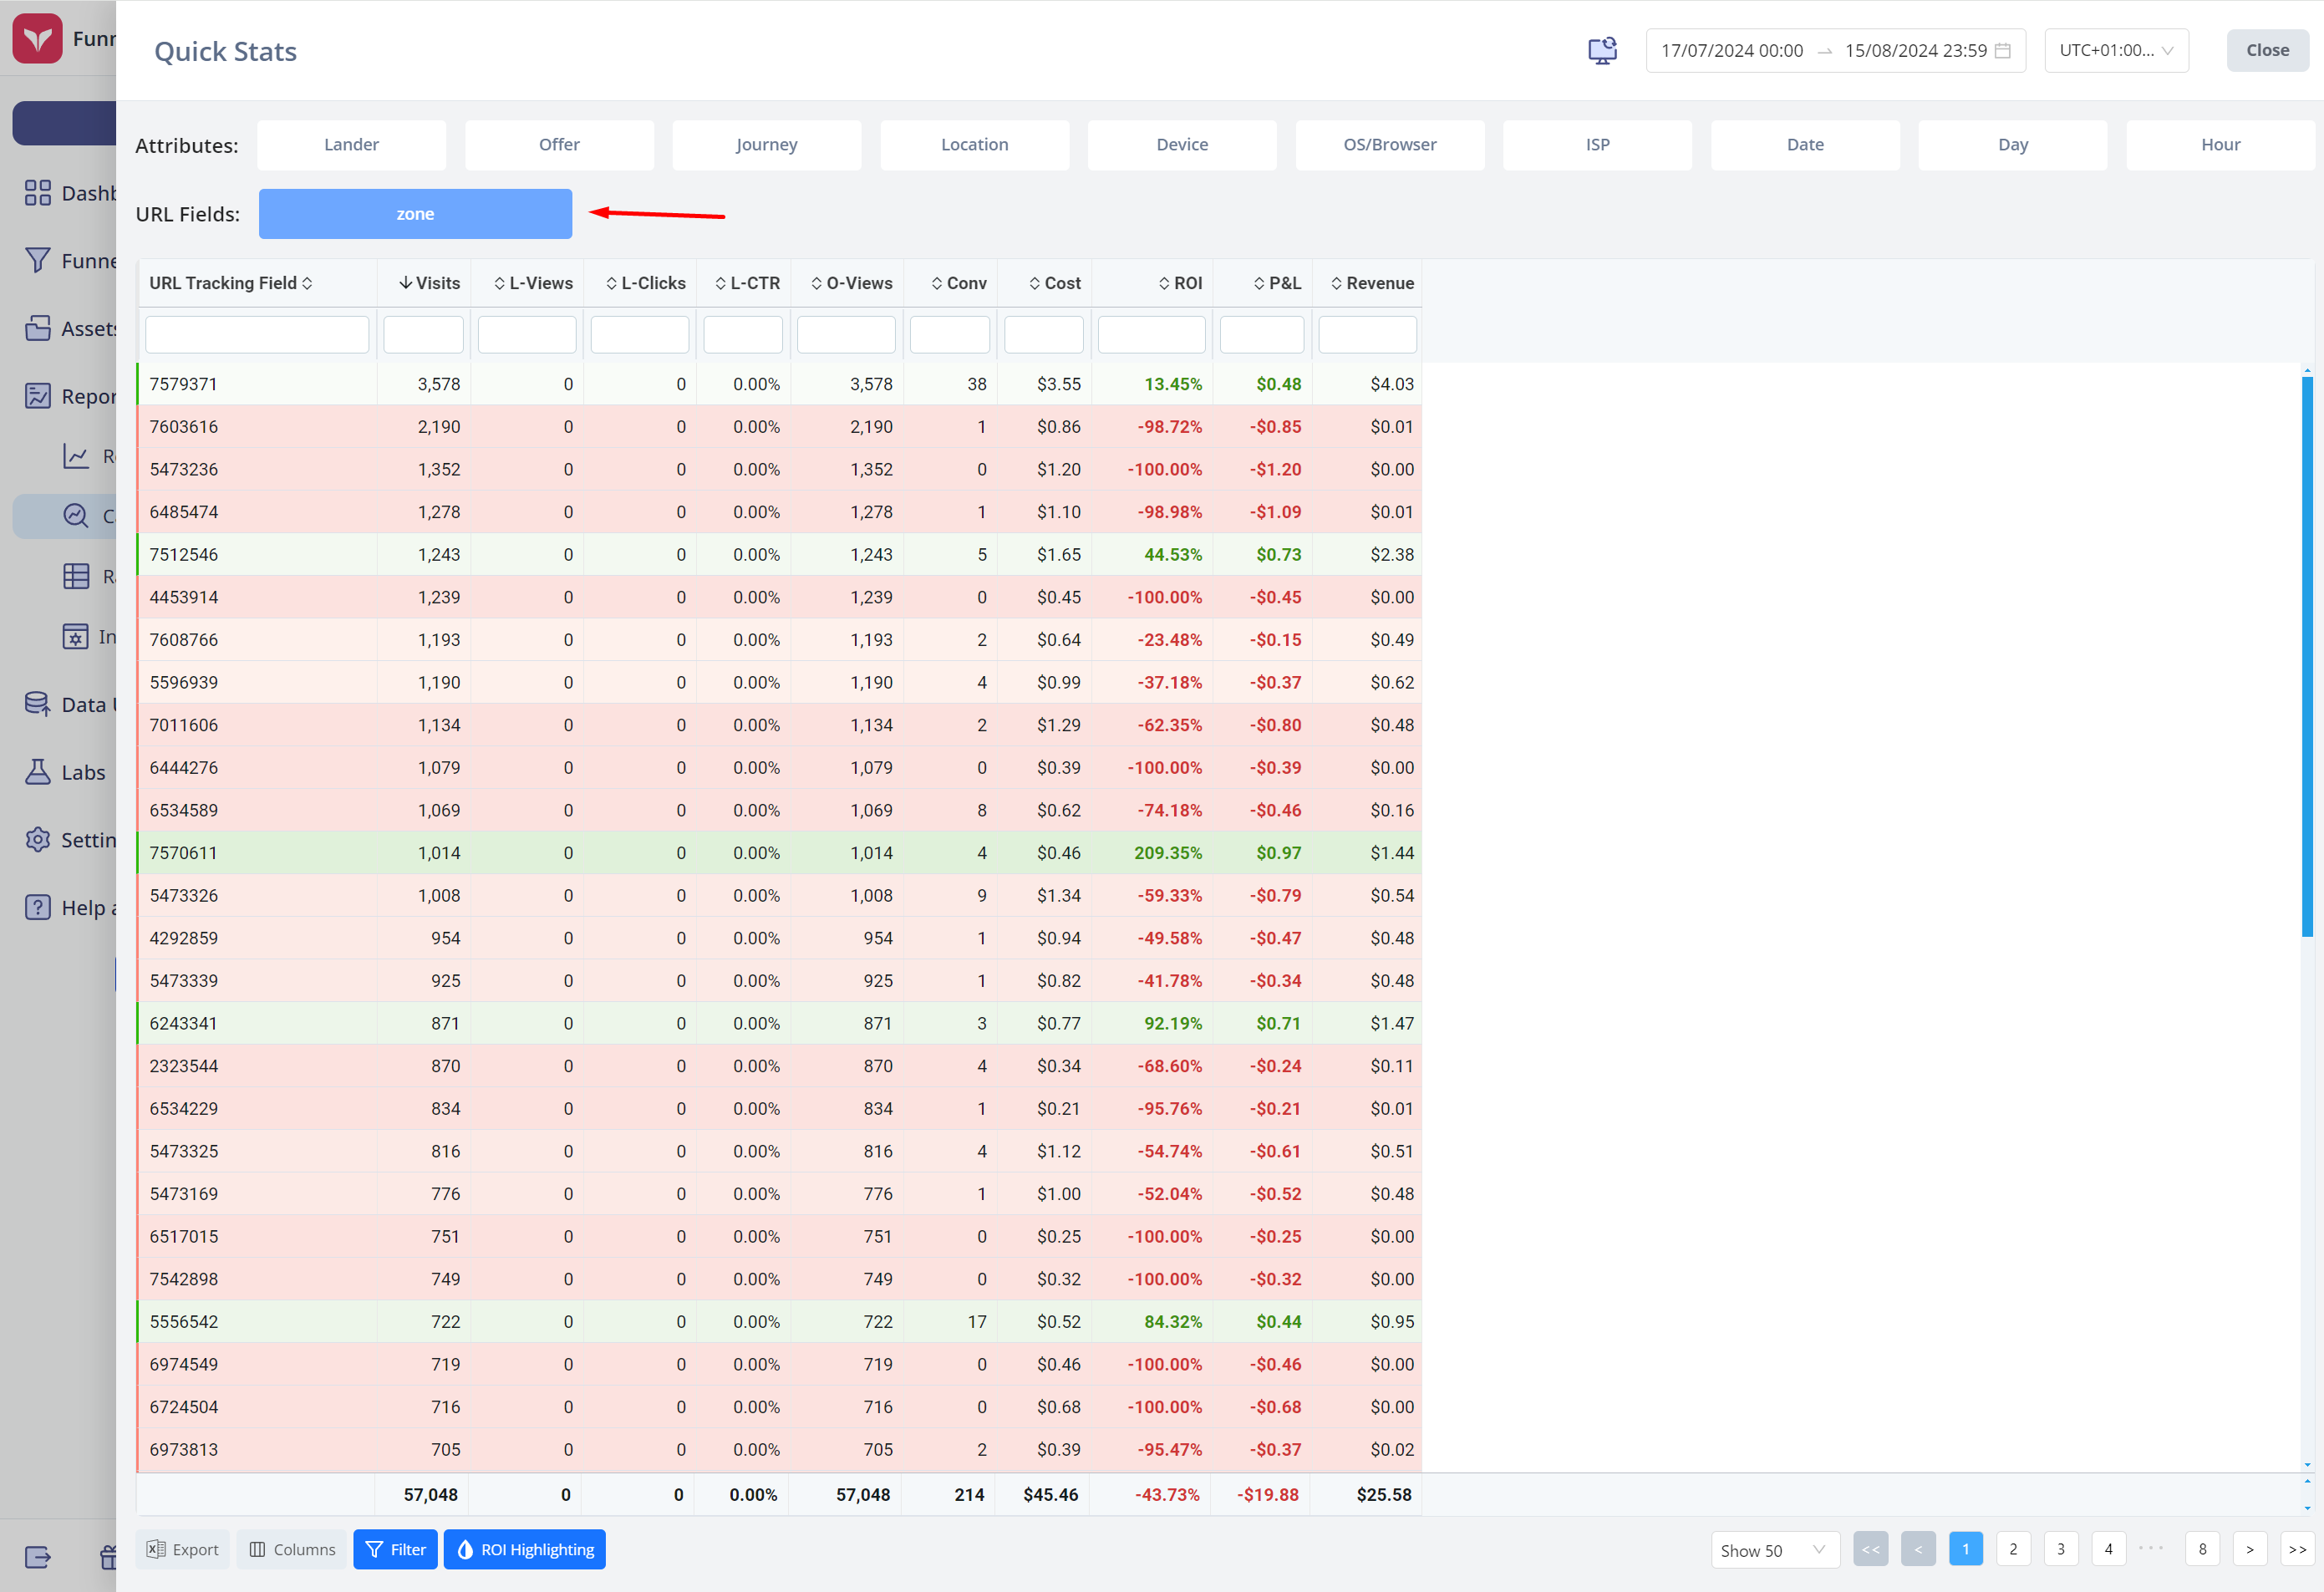
- The quickstats overlay is customised in this area, as below
- We removed funnel, traffic source and campaign report buttons, as you are already drilled down into a specific combo anyway
- All URL tracking fields have their own report button, so you can quickly break down by these
- All reports are flat, so its easy to filter by strings or values
- We also enabled, system-wide, click and drag to select > copy in the table
The last two points are important to note, as now you can readily do an optimisation routine like so:
- Group by zone ID from some traffic source
- Sort zones by ROI
- Filter to all zones with at least $1 spend and <3 clicks (or CPV above some value)
- Filter by all zones with 0 conversions
- Click and drag to select the zone IDs > copy
- Paste this into some blacklist at the traffic source to turn these zones off
This kind of workflow is not so easy in the normal reporting UI due to the many more steps in the tree, the fact its a tree structure, and the difficulties with inline filtering in such a tree.
Overall, the Campaign Analysis page is here to make this kind of analysis fast and easy.
In the future, we also plan to add traffic source syncing for campaign names, so that these IDs can be automatically aliased to the campaign name rather than ID. We understand IDs are more annoying to read, but its conversely not so ideal to pass names (which can be sensitive or revealing) in ad URLs.