

On most of our pages with tables with a number of action icons, including this one:
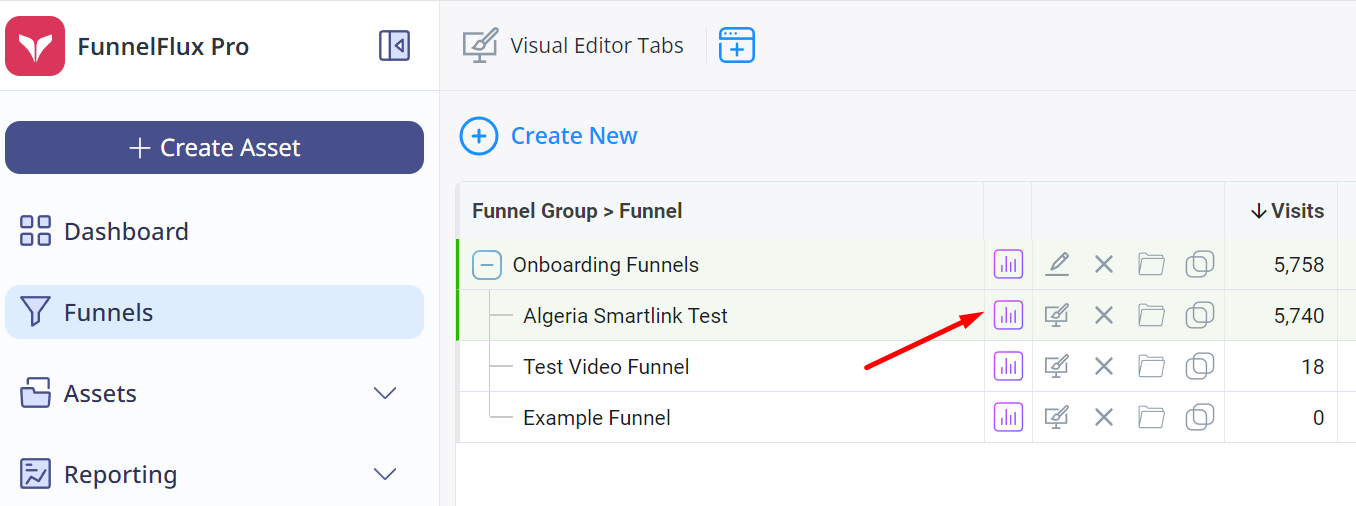
These buttons open Quickstats, our dynamic overlays that let you break down data quickly with pre-set reports. Think of them like a "drill down" action.
When you click one of these, it will open an overlay that filters the reporting to that exact row, with the time range set to whatever you had on the original table.
So if you go to the funnels page, set date to last 7 days, then click the quickstats icon in the image above, it would load a report in the overlay that is set to last 7 days and filtered by traffic source category = Uncategorized (which is what I clicked in the above image).
These overlays are convenient because you can click to open, not leave your current page, then close them just as readily.
It's our fast and easy way to dig into your data without having to custom build reports on the reporting page.
Here's what the Quickstats overlay looks like:
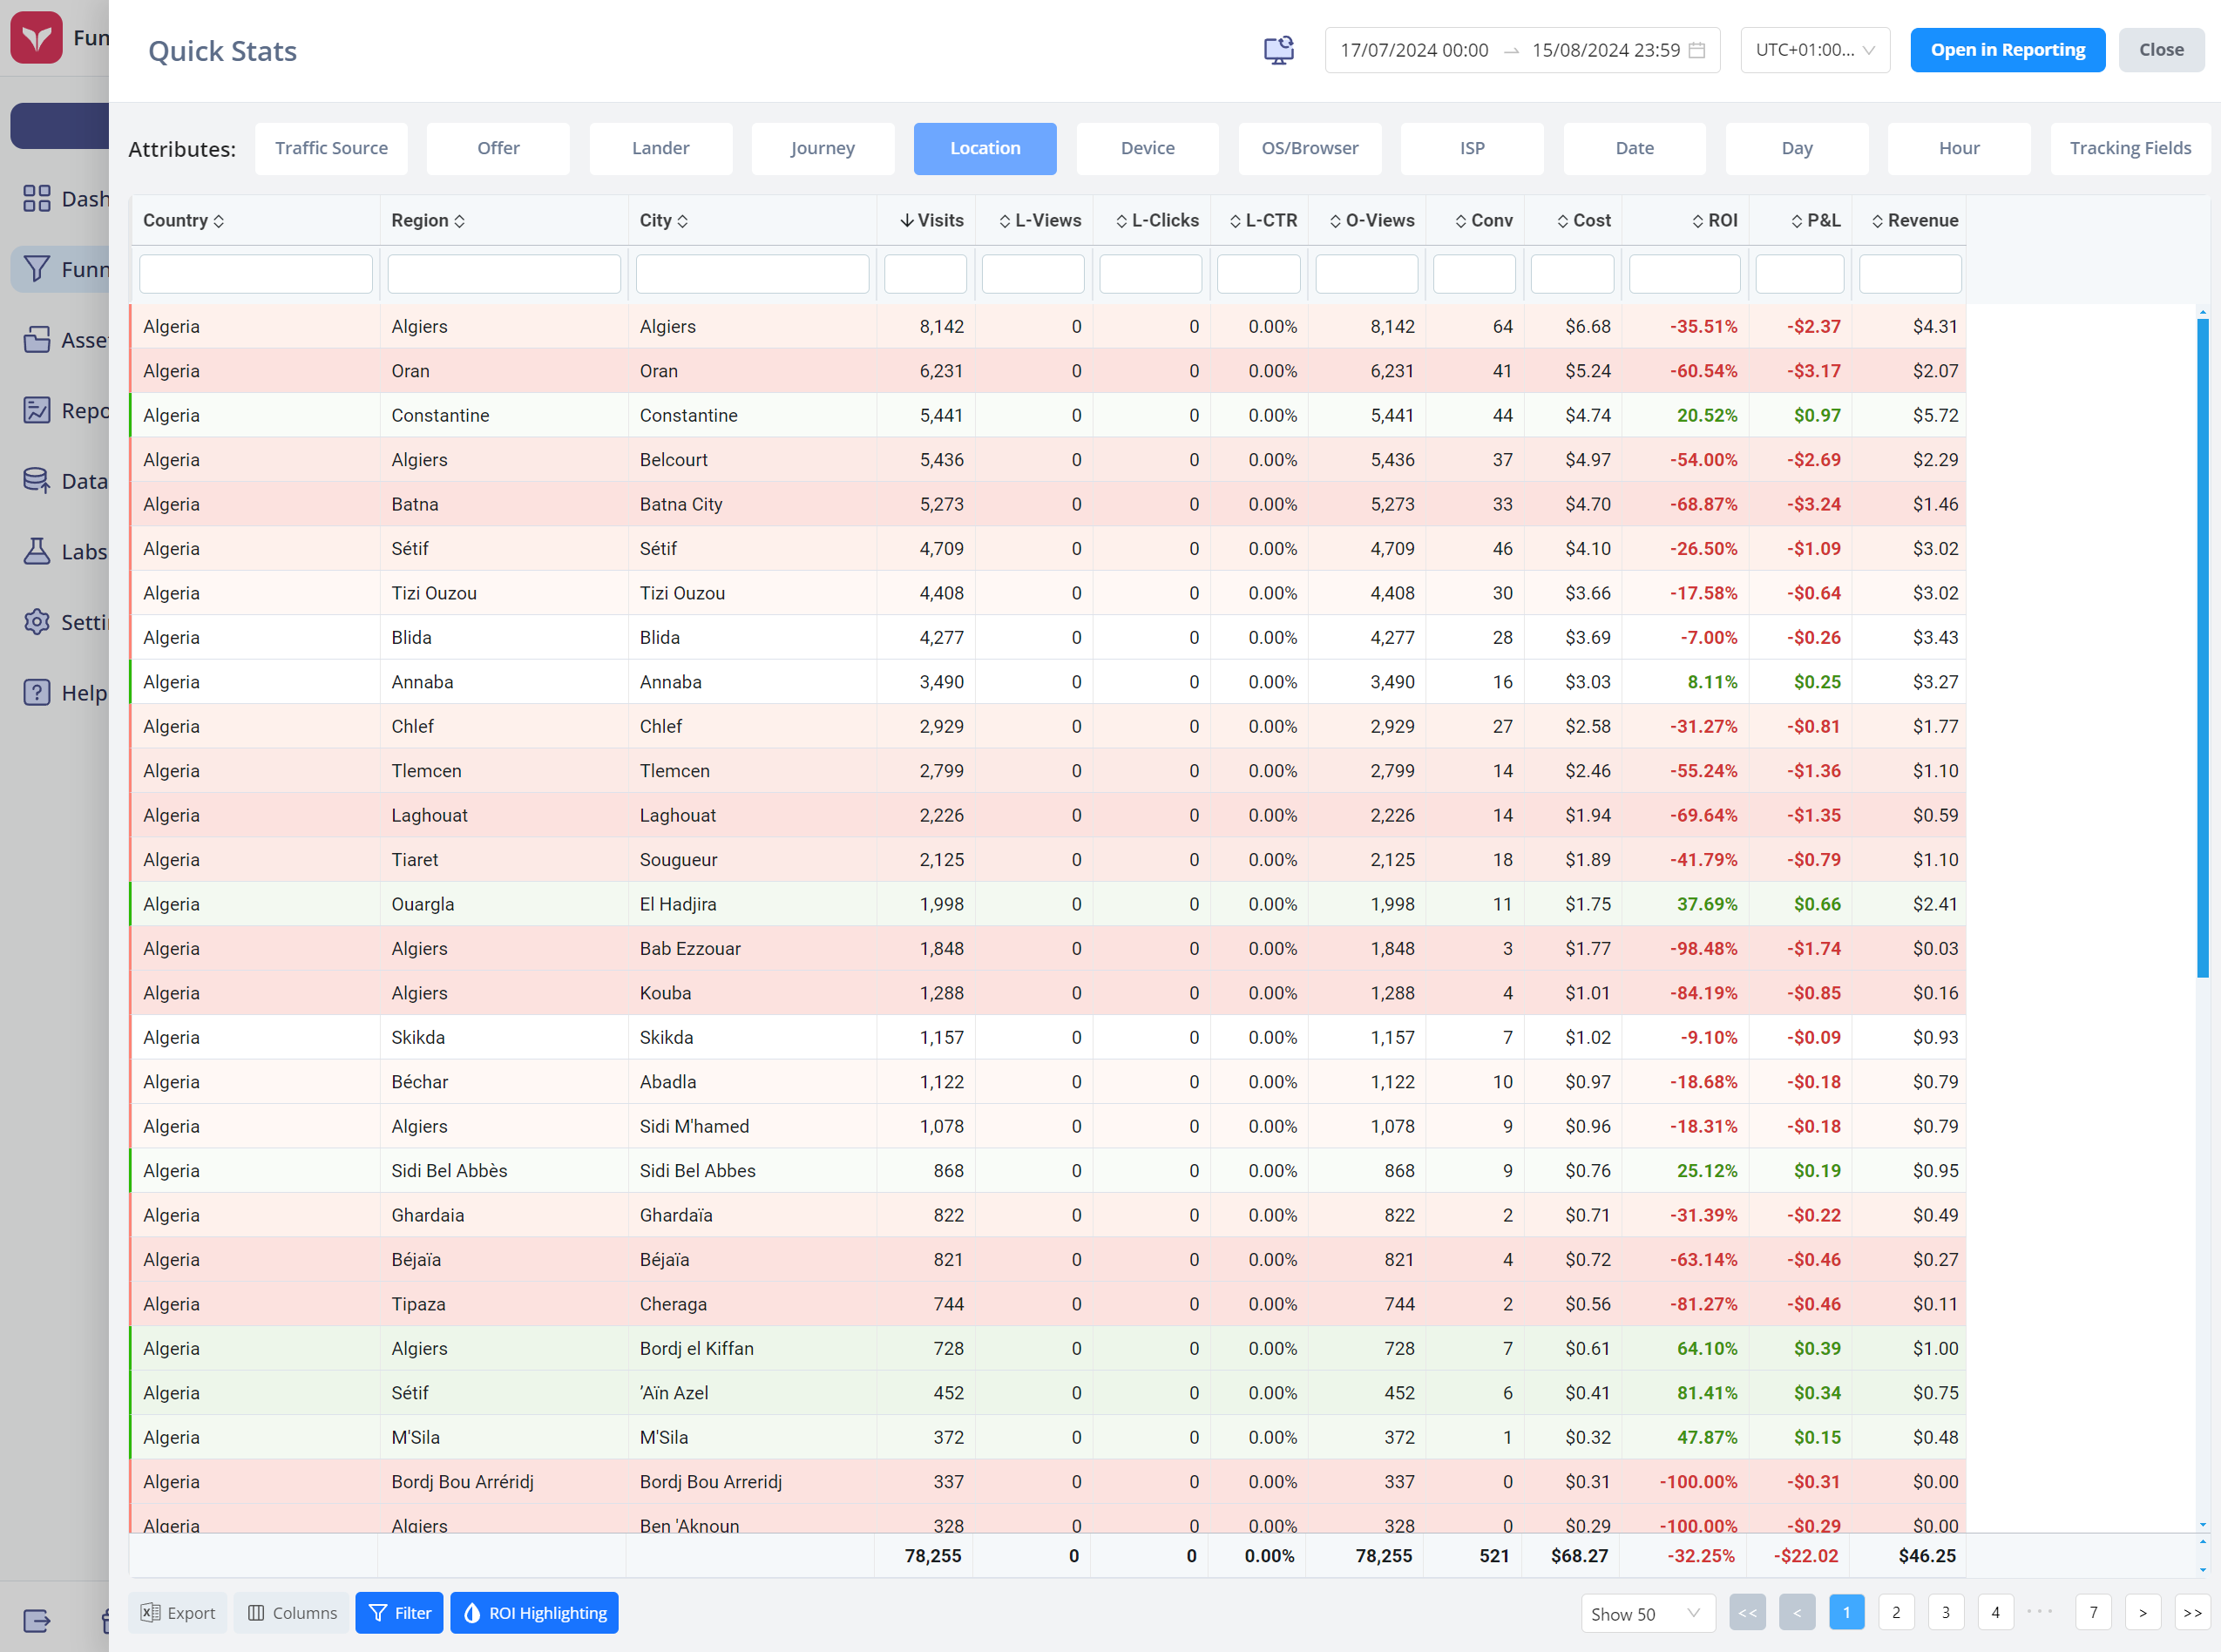
It starts on the funnels quick report. Click any of the other buttons to load other reports.
The (Visitor) Journey, Location and Tracking Fields reports are particularly useful reports.
Much like other reporting pages, you can change column settings, filter, and expand/collapse everything.
Note that when you open overlays, the columns reset to whatever they were on the underlying page. The context is transferred, except for filter/ROI highlighting which we always turn on by default (since you'll often use it, and it saves some clicks).
You can also click the "Open in Reporting" button to go to the reporting page with the current opened report's attributes set and the report will autoload.
So, get clicking!